


This sunday preview covers the week of June 30 to July 5, 2026. The dollar is closing out a strong June, and the desk reads the last few softer sessions as a pause inside that strength, not a turn. The bid is underwritten by a higher-for-longer Fed and sticky inflation expectations, while the euro side stays relatively soft.
The desk confirms the trend through the majors: it wants EUR/USD, GBP/USD and gold to put in lower highs and roll back over rather than reverse the dollar. What changed since the last update: the dollar eased for a few sessions, lifting EUR, GBP and gold, but the monthly picture still favours the dollar and the desk treats the bounce as counter-trend.
Watch today: it is month-end, so rebalancing flows mean elevated volatility and price can move against the macro and technical read intraday; the desk waits for confirmation rather than chasing the chop. Event risk this week: ISM Manufacturing PMI on Wednesday 1 July, then the June US jobs report on Thursday 2 July (brought forward ahead of 4 July).
This sunday preview breaks down why the dollar is bid, the levels that matter, the data that decides July, and the intermarket map that ties it all together. The sunday preview treats the dollar’s bid as structural, not temporary, and this sunday preview lays out exactly what would prove that view wrong.
For a deeper look at [how the Fed shapes the dollar], this sunday preview recommends understanding the rate spine that drives the greenback.
Two Ways a Dollar Rallies, and Why This One Is the Durable Kind
There are only two reasons the dollar rises, and they are not equal. The first is fear, a panic bid where capital runs to the world’s reserve currency in a crisis. The second is yield, where the dollar simply pays you more to hold it than the alternatives.
A fear bid is violent and short. It drains out the moment the headline fades, which is exactly what happened when the geopolitical risk premium came back out of the market earlier this summer. A yield bid is slower and far more stubborn. It lasts until the rate story itself changes.
What is driving the dollar now is the second kind. That is the single most important thing to understand about this sunday preview, because it tells you the pullbacks are pauses, not reversals, until the rate story turns. This sunday preview emphasizes that the yield bid is the durable kind.
For a deeper look at [interest rates and forex], this sunday preview covers how yields drive the greenback. Every serious sunday preview should cover the yield channel.
The Mechanism Most Traders Miss: The Dollar Is a Real-Yield Trade
Here is the part that separates a desk read from chart-watching. The dollar does not really care about the level of inflation on its own, and it does not care about any single news headline for longer than a session. It cares about the expected path of US real yields, the return you earn after inflation, measured against the rest of the world.
When the market believes the Fed will hold firm or hike while other central banks sit still or cut, US real yields rise relative to everyone else, and global capital rotates into dollars to capture the difference. That is the channel every dollar move runs through.
If you want to see it before it reaches the DXY chart, watch three things. The two-year Treasury yield, which is the cleanest proxy for where the market thinks the policy rate is going. The ten-year inflation-protected yield, the real yield itself. And the gap between US yields and German or Japanese yields, because the dollar is a relative trade, never an absolute one.
When those move, the dollar is already moving underneath the price. Most retail traders react to the dollar candle. The desk reads the rate market that prints it. This sunday preview is built on that read. A proper sunday preview always watches the rate market first.
For the official source, the Federal Reserve publishes the monetary policy framework that shapes real yields.
Why the Euro Is the Dollar’s Shadow
One technical point that pays for itself. The Dollar Index is not evenly spread across the world. It is dominated by the euro, which carries roughly 57.6 per cent of the weight, with the yen near 13.6 per cent and the pound near 11.9 per cent making up most of the rest.
In practice that means DXY is, to a first approximation, an inverse euro chart. So when you read “the dollar is strong,” what the index is really telling you most of the time is that the euro is weak against it, which is why EUR/USD has been pinned near 1.14, its lowest in about a year.
If you trade the dollar, you are trading the European Central Bank against the Federal Reserve whether you realise it or not. That is why the desk always checks the rate gap, not just the DXY line. This sunday preview treats the euro as the dollar’s shadow. A balanced sunday preview always considers the euro’s weight in the index.
The Engine: A Flipped Fed and a One-in-Three July Hike
For nearly two years the only question on the dollar was when the Fed would cut. That question has flipped. After the Fed held its policy rate at 3.50 to 3.75 per cent in June, firmer inflation data put a July hike back on the table, and the market is now pricing better than a one-in-three chance of it.
As of late June, futures implied roughly a 37.6 per cent probability of a hike at the 29 July meeting, against a 62.4 per cent hold. A month earlier that number was a rounding error. The exact figure is not the point, because it moves with every print. The direction is the point. The odds are climbing, not falling, and a rising hike probability is the cleanest reason there is for a bid dollar.
This is a data-dependent Fed in the mould of “we are watching the data,” so the path is not a guess, it is decided at the data. This sunday preview tracks that path closely.
Confirmed fact versus interpretation. Confirmed: the Fed held at 3.50 to 3.75 per cent in June and is explicitly data-dependent. Confirmed: market-implied odds of a July hike have risen sharply. Interpretation: the desk’s base case is that the dollar stays bid while those odds hold or climb, and softens only if the data forces the odds back down. That is a view, not a certainty, and the data gets a vote every two weeks.
The Jobs Report That Lands on Thursday, and Why It Matters This Much
Normally the US jobs report, non-farm payrolls (NFP), drops on the first Friday of the month. This July it has been pulled forward to Thursday 2 July, because the US is closed on Friday 3 July for the Independence Day holiday. So the single biggest data print of the month lands a day early, the day after Warsh speaks. Two catalysts, back to back, in the most important week for the dollar in months. This sunday preview treats the jobs report as the week’s key catalyst.
The desk does not just watch the headline number. It reads three things, in this order, because together they tell you whether the economy is still running hot enough to keep the Fed tight. A proper sunday preview always breaks down the components, not just the headline.
Jobs added (the headline): a strong number says the labour market is still resilient despite higher rates. Resilience is exactly what lets the Fed keep policy tight without breaking anything.
The unemployment rate: low and steady, or falling, signals a tight labour market with little slack. A tight labour market keeps upward pressure on prices.
Average hourly earnings (wages): this is the inflation tell, and the number the desk weights most. Rising wages feed straight into services inflation, the stickiest kind there is. Hot wages are what actually move the Fed. This sunday preview weights wages more than the headline.
The mechanism, plainly. Strong jobs plus rising wages means the economy is running hot, and a hot economy is inflationary. An economy that keeps adding jobs and paying people more while rates are already high is an economy that can withstand those rates, and one that does not need cuts. That is the core read of this sunday preview.
That is the whole story behind the dollar’s bid: the market is being forced to price higher for longer and to take rate cuts off the table. A healthy, inflationary labour market is fuel for the dollar, not a problem for it. This sunday preview treats that as the structural anchor.
You can see it in the pricing. A genuinely hot print would push the market-implied odds of a July hike from the high-30s up toward the 50 to 60 per cent range, and the market is now carrying as many as four potential hikes across 2026, a year that began pricing in none at all. That repricing, from no hikes to several, is the engine underneath the entire move. A soft print does the opposite: odds fall, and the dollar eases back toward the downside ladder above. This sunday preview maps both outcomes.
For the official source, the CME FedWatch Tool tracks the market-implied hike probabilities.
Why July Is the Month That Decides It
Three prints land before the decision, and each one moves the hike odds, and the dollar with them. This sunday preview treats each as a potential catalyst.
| Date | Event | Why It Matters for the Dollar |
|---|---|---|
| 25 June (done) | Core PCE | The Fed’s preferred inflation gauge. It printed, and the dollar eased slightly without breaking trend. |
| 2 July | June payrolls (NFP) | A strong labour market keeps the hike alive and supports the dollar. A weak one pulls the odds down. |
| 14 July | June CPI | Sticky inflation is the strongest single case for a hike, and the strongest fuel for the dollar. |
| 29 July | FOMC decision | The decision and, just as important, the guidance on what comes after it. |
Hot prints lift the odds and the dollar. The recent run has leaned hot. That is why the desk’s base case is for strength to persist unless the data turns. This sunday preview is built around that base case.
The Levels and Structure That Matter
The macro comes first, but structure tells you whether the move is healthy. The trend on DXY is up, and dips have been bought rather than sold. The index has been pressing the 101.80 area as overhead resistance while holding a rising series of higher lows beneath.
The honest read is that the dollar is stretched after a hard run, so a profit-taking pullback is a normal pause, not a reversal. The thing that would genuinely change the read is a clean break of the rising higher-low support that has defined this trend. Until that gives way, dips are pauses.
Overhead: the 101.80 area, the ceiling the dollar keeps testing.
Where we are: around 101.5, consolidating just beneath that ceiling.
The line that matters: the rising higher-low support. Hold it and the trend is intact. Break it on a soft print and the read changes.
The Liquidity Map: The Next Levels Both Ways
Levels are not predictions. They are the pools of resting liquidity, the clusters of orders and stops, that price gravitates toward. The desk maps the next pool above and below so you know where a move is likely to extend, and where it is likely to stall.
Right now the dollar index is pressing the top of its range with the trend pointing up, so the desk’s lean is higher while the rising higher-low support holds. This sunday preview maps both sides.
If the breakout continues: the upside ladder (the desk’s lean)
| Level | Why It Is the Next Pool of Liquidity |
|---|---|
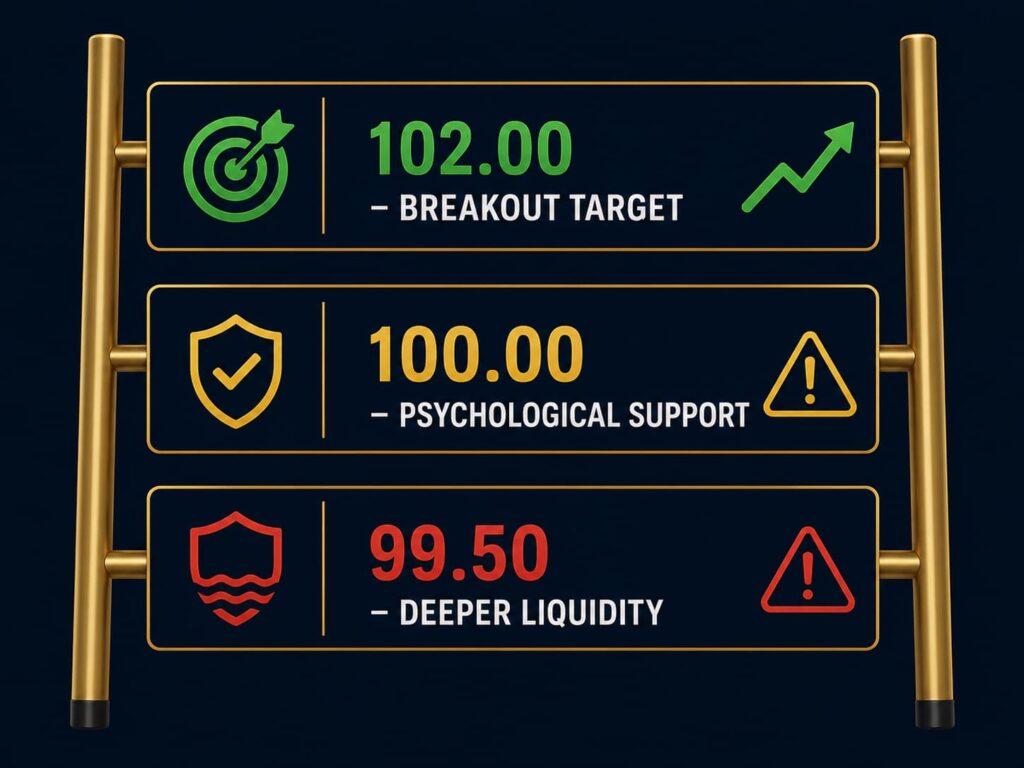
| 102.00 | The May 2025 swing highs. The first major shelf of resting liquidity above the range. |
| 103.50 | The next shelf north. Prior supply and a round-number cluster where earlier sellers stepped in. |
| 104.50 | The extended target if the inflation trade really runs and rate-hike pricing keeps climbing. |
If the data cracks: the downside ladder (lower probability)
| Level | Why It Is the Next Pool of Liquidity |
|---|---|
| 101.50 | The breakout shelf and first support on a pullback. A normal profit-taking dip can test this without changing the trend. |
| 100.00 | The psychological round number and a prior consolidation pocket. Losing it would say the pullback has turned into something deeper. |
| 99.50 to 99.00 | The deeper liquidity that comes into play only if trend support breaks on a genuinely soft print. |
Three Scenarios into the 29 July FOMC
This sunday preview maps three paths into the 29 July FOMC.
Scenario 1: Hot data, the base case (50%)
PCE firm, jobs strong, CPI sticky. The hike odds push toward 50 to 60 per cent, the dollar extends, and the majors and gold stay under pressure. This is the path the recent data leans toward. This sunday preview treats this as the base case.
Scenario 2: Mixed data (35%)
Some firm, some soft. The dollar stays bid but choppy, with normal pullbacks that get bought. The trend survives, but the ride is two-sided and you respect both edges.
Scenario 3: Soft data, less likely (15%)
Soft PCE, a weak jobs print, a cooler CPI. The hike comes off, and you get the first real correction in the dollar, which hands the euro and gold a floor. The desk treats this as possible, not the base case right now, but it is the scenario that flips the month.
What Would Flip the Dollar Lower
A good desk always knows what would prove it wrong. For the dollar the bear case is simple: the data cools. This sunday preview treats the bear case as the scenario that would flip the entire read.
One soft inflation print plus one weak payrolls number would pull the hike bets back out, compress the dollar’s yield advantage, and break that higher-low structure. That is the risk this sunday preview is watching most closely.
A genuine risk-off panic could also spike the dollar short term and then unwind it once the Fed is forced dovish. This sunday preview notes that a panic spike is different from a structural bid.
And the tail nobody prices until it happens is a policy surprise or intervention from another major central bank that closes the rate gap from the other side. This sunday preview keeps that tail on the watchlist.
None of these is the base case today. But if you see the higher lows break on a soft print, you respect it rather than argue with it. This sunday preview respects both sides of the trade and has a plan for each.
The Intermarket Map: The Dollar Is the Master Key
The reason the desk leads with the dollar is that it shows up everywhere. The same single move wears different faces across your screen. A complete sunday preview always maps the intermarket read.
EUR/USD near 1.14, its lowest in about a year, because the euro is the biggest mirror of dollar strength. This sunday preview treats EUR/USD as the dollar’s clearest reflection.
GBP/USD grinding toward the 1.30 area, dragged by the same dollar bid plus its own UK politics. This sunday preview notes that sterling has its own headwinds beyond the dollar.
Gold heavy near the 4,000 to 4,050 area, because a firm dollar and firm real yields are the cleanest headwind there is for an asset that pays you nothing to hold. This sunday preview reads gold as the dollar’s shadow.
USD/JPY elevated, because the rate gap between a firm Fed and a slow Bank of Japan keeps the carry working. This sunday preview sees USD/JPY as the anchor that held the dollar flat on risk-off days.
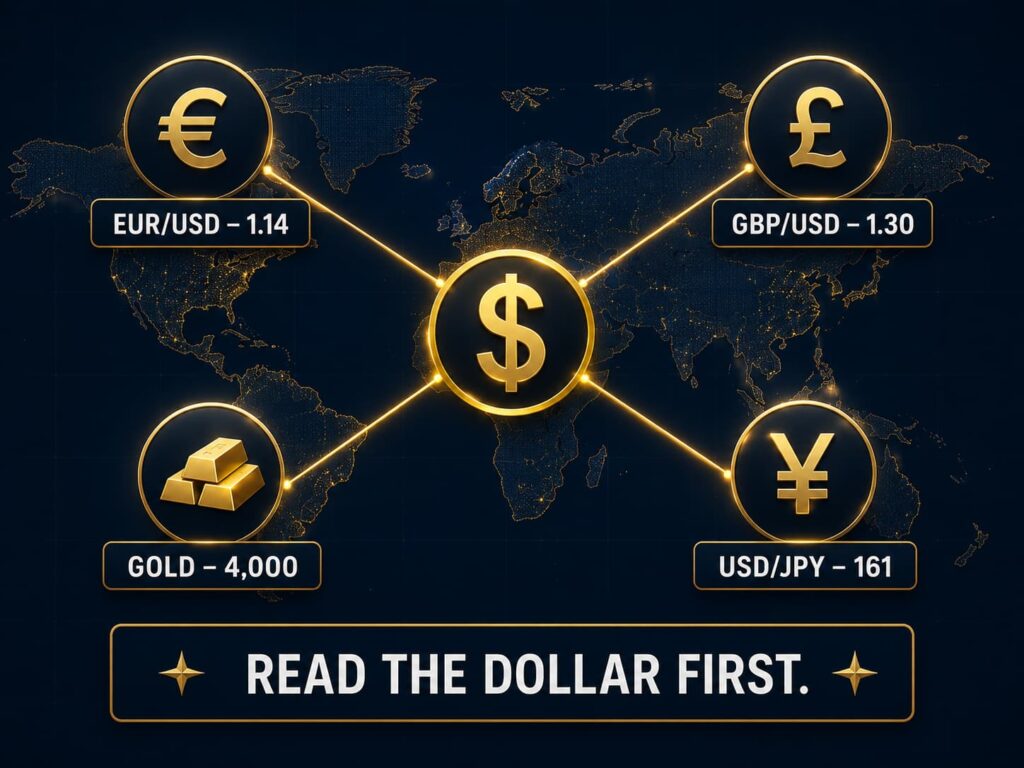
You cannot read any of these in isolation. Read the dollar and the rate path first, then take the EUR, GBP, gold or yen setup with the wind behind it instead of against it. That is the core message of this sunday preview.
Gold: The Dollar’s Headwind
Gold is heavy near the $4,000 to $4,050 area, and the desk reads this as confirmation of the dollar’s structural bid, not a failure of the safe-haven trade. This sunday preview treats gold as the clearest read-through of dollar strength.
The relationship is simple. Gold has two main inputs: real yields and the dollar. When the dollar firms, gold struggles. When the dollar eases, gold rallies. The current dollar bid is not a fear bid—it is a yield bid—and that is exactly the kind of dollar bid that weighs on gold.
Even with geopolitical headline risk (Houthi threats, French naval deployments, Strait of Hormuz tensions), gold has not broken out to the upside because the rates and dollar drag are overpowering the safe-haven bid. The market is reading the Middle East risk as a dollar-adjacent story (US allies are the exposure, not the US homeland), so the haven flow is going to gold only when the dollar is not the dominant trade.
What would change the read: A genuine escalation that threatens US assets directly could give gold a pure haven bid that overrides the dollar. Alternatively, a soft US jobs print on Thursday that pulls the Fed’s hike odds down would ease the dollar and lift gold through the $4,100 resistance.
Key levels: $4,000 is the psychological floor. $4,100 is the first resistance, and $4,200 is the level that would question the bearish gold read. The desk is watching gold near the $4,000 handle as a structural level that defines the range. Losing it opens $3,950 and the March lows; reclaiming $4,100 flips the short-term bias.
For more on [gold trading strategies], this sunday preview covers how real yields and the dollar drive the metal.
S&P 500: The Fragile Rally
The S&P 500 has held up near its highs, but the internal structure is not as healthy as the headline index suggests. The desk reads the tape as fragile bullishness—the index is supported by AI-driven mega-caps while the rest of the market lags. This sunday preview treats the equity rally as the weak link in the risk-on narrative.
The key risk is the Fed’s policy path. If the July jobs report prints hot and pushes hike odds toward 50-60%, the discount rate rises. That is a direct headwind for the longest-duration parts of the market—tech and AI names—which have been the leaders of this rally. A hot jobs print could trigger a rotation out of tech and into defensives, similar to what we saw during the previous risk-off tape when the Nasdaq bled while the Dow held.
The other side of the coin is a soft print. If the data cools and the Fed’s hike odds drop, equities could get a relief rally. But the desk would treat that as a short-term bounce, not a trend change, because the underlying macro reality (sticky inflation, higher-for-longer rates, geopolitical uncertainty) has not changed.
Key levels: 7,100 is the first support on a pullback. 7,300 is the resistance that has held. A break above 7,300 would suggest the market is pricing a soft landing. A break below 7,100 would open the door to 7,000, the psychological level that defines the bull/bear sentiment.
For more on [market structure and equities], this sunday preview covers how the Fed’s policy path affects stock valuations.
The Bigger Picture: The 2026 Dollar Regime
Step back from July and the structure is the same one that has run the dollar all year: a US economy that keeps refusing to break, an inflation pulse that keeps refusing to fully cool, and a Fed that has moved from “when do we cut” to “do we actually need to hike.”
As long as that holds, the dollar carries a structural yield advantage over the rest of the developed world. The risk to the view is not technical, it is the data finally turning, the labour market cracking, and the Fed being handed the cuts it has resisted. That is the regime change to watch for. Until it arrives, the path of least resistance for the dollar has been up.
The Desk View
The July outlook for the dollar is bullish as a base case. The driver is the US real-yield path, the engine is the repricing toward a possible Fed hike, and the trigger dates are payrolls, CPI and the 29 July FOMC.
The structure is higher while the rising support holds, with 101.80 the ceiling to clear and the higher-low support the line that defines the trend.
You cannot read the euro, the pound or gold by themselves this month. Read the dollar and real yields first, then take the setup with the wind behind it. And keep one eye on the soft-data scenario, because that is the one that flips the month.
What to Watch
- The market-implied odds of a July hike. Rising odds support the dollar, falling odds undercut it.
- June payrolls on 2 July and June CPI on 14 July. Hot supports the dollar, soft pressures it.
- The 101.80 ceiling and the rising higher-low support on DXY.
- EUR/USD near 1.14 and gold near 4,000 to 4,050 as the clearest read-throughs of dollar strength.
Disclaimer
This article is for educational and informational purposes only. It does not constitute financial advice, trading recommendations, or an offer to buy or sell any asset. Trading forex, commodities, indices, cryptocurrencies, and futures carries significant risk and may not be suitable for all investors. You can lose more than your initial deposit. Past performance does not guarantee future results. Always read full terms, contract specifications, and risk disclosures before trading. Do your own research. Consult a licensed financial advisor if you need professional investment advice.