In the world of currency trading, Forex indicators play a pivotal role in helping online traders make informed decisions about entry and exit points, potential trend reversals, and market momentum. These indicators, derived from mathematical computations based on historical data, provide visual tools and insights to identify patterns in the ever-fluctuating foreign exchange market.
There are various types of Forex indicators, each serving its unique purpose:
Trend Indicators: These help traders identify and confirm the direction of a trend. Examples include Moving Averages, MACD, and the ADX.
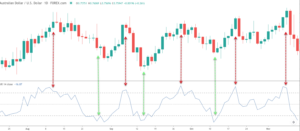
Momentum Indicators: These reflect the speed at which prices move over a specific period. RSI, Stochastic Oscillator, and Williams %R are popular momentum indicators.
Volume Indicators: By gauging the volume of trade, these indicators assess the strength of a price movement. Common ones include the Money Flow Index (MFI) and On-Balance Volume (OBV).
Volatility Indicators: These measure the rate and magnitude of market movements. Bollinger Bands and the Average True Range (ATR) are examples.
Support and Resistance Indicators: Tools like Pivot Points and Fibonacci Retracement levels help traders identify potential barriers in the market.
Using Forex indicators requires a combination of technical analysis skills and intuition. While they provide valuable insights, relying solely on indicators without considering broader market context can lead to potential misjudgments. It’s crucial for traders to use them in conjunction with other analytical tools and methods, ensuring a holistic approach to Forex trading.
| Category | Indicator | Short Description | Founder/Originator |
| Trend Indicators | Moving Averages (SMA, EMA, WMA) | Averages of past prices. | N/A |
| MACD | Shows the relationship between two moving averages. | Gerald Appel | |
| ADX | Measures the strength of a prevailing trend. | Welles Wilder | |
| Ichimoku Cloud | Visualizes support/resistance and momentum. | Goichi Hosoda | |
| Hull Moving Average (HMA) | Smoothens price data. | Alan Hull | |
| McGinley Dynamic | Responsive moving average. | John R. McGinley | |
| MESA Adaptive Moving Average (MAMA) | Adjusts to price change rate. | John Ehlers | |
| ZLEMA | EMA that attempts to eliminate lag. | John Ehlers | |
| ____________________________________________________________________________________________________________ | |||
| Momentum Indicators | RSI | Assesses overbought/oversold conditions. | Welles Wilder |
| Stochastic Oscillator | Compares closing price to its price range. | George C. Lane | |
| Williams %R | Measures momentum by comparing closing price to range. | Larry Williams | |
| Momentum | Rate of change of price. | N/A | |
| Chande Momentum Oscillator (CMO) | Measures momentum on up and down days. | Tushar Chande | |
| Stochastic RSI | Applies the stochastic formula to RSI values. | Tushar Chande & Stanley Kroll | |
| True Strength Index (TSI) | Shows trend direction and overbought/oversold. | William Blau | |
| ____________________________________________________________________________________________________________ | |||
| Volume Indicators | Money Flow Index (MFI) | RSI but with volume. | Gene Quong & Avrum Soudack |
| On-Balance Volume (OBV) | Cumulative total of volume. | Joe Granville | |
| Chaikin Money Flow (CMF) | Combines price and volume to show money flow. | Marc Chaikin | |
| Rate of Change (ROC) | Measures percentage change in price. | N/A | |
| Negative Volume Index (NVI) | Focuses on periods when volume decreases. | Paul Dysart & Norman Fosback | |
| Positive Volume Index (PVI) | Focuses on periods when volume increases. | Paul Dysart & Norman Fosback | |
| Price and Volume Trend (PVT) | Integrates volume and price. | N/A | |
| Price Volume (PV) | Multiplies close price by volume. | N/A | |
| ____________________________________________________________________________________________________________ | |||
| Volatility Indicators | Bollinger Bands | Sets bands around moving average. | John Bollinger |
| ATR | Measures market volatility. | Welles Wilder | |
| Parabolic SAR | Provides entry/exit points. | Welles Wilder | |
| Ulcer Index | Measures downside risk. | Peter Martin & Byron McCann | |
| Vortex Indicator | Identifies new trends or continuation. | Etienne Botes & Douglas Siepman | |
| ____________________________________________________________________________________________________________ | |||
| Support and Resistance | Pivot Points | Determines overall market trend. | N/A |
| Fibonacci Retracement levels | Indicates potential support/resistance levels. | Leonardo Fibonacci (Concept) | |
| Gann Lines | Predicts price movements. | W.D. Gann | |
| ____________________________________________________________________________________________________________ | |||
| Oscillators & Cycles | Aroon | Identifies when an asset is trending. | Tushar Chande |
| Aroon Oscillator | Shows strength between bulls and bears. | Tushar Chande | |
| Bears Power | Measures balance of power between bears and bulls. | Alexander Elder | |
| Bull Power | Opposite of Bears Power. | Alexander Elder | |
| Coppock Curve | Momentum indicator for investors. | Edwin Coppock | |
| DPO | Removes trend from price. | N/A | |
| EoM | Shows ease with which prices move. | Richard W. Arms Jr. | |
| Fisher Transform | Makes price data a Gaussian-like distribution. | John F. Ehlers | |
| Klinger Oscillator | Volume-based oscillator. | Stephen J. Klinger | |
| Market Facilitation Index | Shows price movement for a volume. | Bill Williams | |
| Mass Index | Highlights reversals based on range expansions. | Donald Dorsey | |
| OsMA | Difference between an oscillator and its moving average. | N/A | |
| PPO | Shows two moving averages percentages. | Gerald Appel & Fred Kline | |
| Qstick | Visualizes difference between open and close prices. | Tushar Chande | |
| Random Walk Index (RWI) | Measures market efficiency. | E. Michael Poulos | |
| Schaff Trend Cycle | Combines MACD and stochastic oscillator. | Doug Schaff | |
| Swing Index | Identifies price swings in the market. | J. Welles Wilder Jr. | |
Understanding Forex Indicators: A Deep Dive
Forex indicators are invaluable tools for traders, helping to predict future price movements based on historical data. Each of these indicators offers a unique perspective on the market, and understanding their mechanisms can greatly enhance a trader’s ability to make informed decisions.
1. The Importance of Indicators:
Forex indicators provide traders with a quantitative way to interpret market trends and signals. They reduce the vast complexity of the market into comprehensible data points, allowing traders to navigate and understand market shifts with more clarity.
2. How to Use Indicators:
Single Indicator Strategy: Some traders prefer to use a single indicator to guide their trading decisions. For instance, they might rely solely on the RSI to determine overbought and oversold conditions.
Combining Multiple Indicators: Others may use a combination, such as the MACD with Bollinger Bands, to get a more comprehensive view of the market. This strategy can help confirm signals and reduce false positives.
3. Limitations of Indicators:
While Forex indicators are powerful tools, they aren’t infallible. They work best when combined with a thorough understanding of the market, a clear trading strategy, and, importantly, trader intuition. Remember:
- No single indicator will provide a foolproof signal.
- Over-reliance on indicators can lead to paralysis by analysis.
- Always consider the broader market context and news events.
4. Customizing Indicators:
Many trading platforms allow users to adjust the parameters of indicators, which can be beneficial. For instance:
- Adjusting the period of a moving average can make it more or less sensitive to price changes.
- Customizing Bollinger Bands might help in identifying volatility more suited to a particular trading strategy.
Always backtest any customization to ensure its efficacy.
5. Continuous Learning:
The world of Forex trading is ever-evolving. As such, traders should remain open to learning about new indicators, tools, and strategies. Engage in continuous education, participate in trading communities, and be open to adjusting your strategies as you gain experience and knowledge.
6. Using Forex Indicators on MetaTrader 4 (MT4)
MetaTrader 4 is one of the most widely used Forex trading platforms in the world, known for its user-friendly interface and a vast array of available indicators. Here’s a guide to get you started on integrating and utilizing these indicators within MT4:
A. Accessing Indicators:
- Open your MT4 platform.
- Look for the ‘Navigator’ panel, typically on the left side.
- Under the Navigator panel, you’ll see a folder named ‘Indicators’. Clicking on this will reveal a list of all available indicators.
B. Applying an Indicator to a Chart:
- Locate the desired indicator within the ‘Indicators’ list.
- Drag and drop the indicator onto the chart of your choice.
- Alternatively, you can right-click on the desired indicator, select ‘Attach to a chart’, and it will be applied to your current chart.
C. Customizing Indicator Settings:
- Once the indicator is applied to a chart, a settings window will pop up.
- Adjust the parameters to fit your strategy. For instance, if you’re using a Moving Average, you can change its period, color, and type here.
- Click ‘OK’ to apply the changes.
D. Multiple Indicators:
- You can apply multiple indicators to a single chart. Simply repeat the steps mentioned above for each indicator.
- Ensure that the indicators don’t clutter the chart, making it unreadable. Adjust the settings or the visualization options to keep the chart clean and understandable.
E. Removing or Editing an Indicator:
- To edit the settings of an applied indicator, right-click on the indicator line/area on the chart, and select ‘Properties’.
- To remove an indicator, right-click on the indicator line/area, and select ‘Delete Indicator’, or navigate to the ‘Indicators List’ by pressing Ctrl+I, select the indicator, and click ‘Delete’.
F. Importing External Indicators:
MT4 allows you to add indicators not found in its default toolset:
- Save the
.mq4or.ex4file of the indicator on your computer. - On MT4, click on ‘File’ at the top left corner and select ‘Open Data Folder’.
- Navigate to MQL4 > Indicators and paste the saved file.
- Restart MT4. The imported indicator should now be available in the ‘Navigator’ panel.
G. Best Practices:
- Always ensure that your MT4 platform is updated to the latest version.
- Experiment with each indicator on a demo account before applying them to a live trading environment.
- If your platform slows down due to the usage of multiple indicators, consider using fewer indicators or upgrading your hardware.
The MT4 platform is a versatile tool for Forex traders, and understanding how to effectively use and customize indicators within the platform can enhance your trading experience. As always, make sure to test any new strategy or indicator in a risk-free environment before going live.
Wrapping Up the Indicators Guide
In the ever-complex world of Forex trading, indicators serve as beacons, guiding traders through volatile market waves with data-driven insights. As we’ve explored, each indicator, from the most common to the lesser-known, offers a unique lens to view market dynamics. But it’s crucial to remember that no single tool offers a magic solution. Successful trading hinges on a blend of these technical tools, a sound strategy, keen market intuition, and continuous learning. As you venture forward, may this guide be a helpful compass, aiding you in making informed decisions and navigating the myriad opportunities the Forex market presents. Happy trading!

Forex Trading and Sustainable Investing: Strategies for Ethical and Sustainable Trading

Guide to Backtesting and Optimizing Forex Trading Strategies

Forex Trading During Major Events and News: A Comprehensive Guide
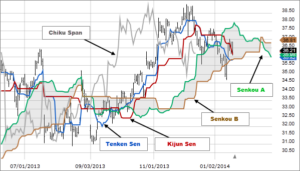
Ichimoku Cloud indicator simply explained. Formula and use in Trading