


The Jackson Hole aftermath has set the stage for one of the most consequential months of the year. Federal Reserve Chair Kevin Warsh delivered his first keynote as chair, three regional presidents called for tighter policy, and the Treasury’s buyback program continued reshaping the long end of the curve. Gold held above $4,600, the dollar caught a bid inside a broader downtrend, and the FX majors coiled into the event. This post-Jackson market wrap covers everything you need to know.
The post-Jackson landscape is defined by a single question: what does the Fed actually do in September? The answer remains unclear, but the data and the speeches have drawn clearer lines around the debate. The Jackson Hole aftermath has given us a more defined range for every major asset.
For more on why traders often struggle during periods of heightened uncertainty, see our guide on why most traders quit.
Jackson Hole Aftermath: The Macro Backdrop
The Jackson Hole symposium was the defining event of the week. Day one was hawkish, with three Federal Reserve officials warning that inflation is too high. Beth Hammack repeated her call for higher rates and said “I believe now is the time to act,” noting inflation has run above target for more than five years and that financial conditions show no sign of restriction. Jeff Schmid said policy at 3.50 to 3.75 per cent may be accommodative rather than restrictive and put a 16 September hike explicitly on the table. The post-Jackson market is still digesting these remarks.
The Treasury simultaneously at least doubled the size of its long end buyback operations from 9 September, taking the 10 to 20 and 20 to 30 year nominal sectors from a 2 billion dollar maximum to at least 4 billion per operation. Scott Bessent said operations could run larger still and that the signal is deliberate because yields do not reflect the underlying fundamentals. The July federal deficit was 432.3 billion, the largest month since March 2021, with the fiscal year to date near 1.8 trillion. The 30 year printed 5.33 per cent on 18 August, the highest since 2007. The post-Jackson macro picture is one of fiscal dominance.
According to Bloomberg, Wall Street piled on rate-hike bets as Warsh renewed his hawkish tone, with the dollar rallying and gold initially falling before recovering . The post-Jackson market reaction was immediate and significant.
Post-Jackson Gold: Holding Above $4,600
Gold is 4,602.57, 4,602.78 and 4,603.03 across three independent sources, a spread of 46 cents and comfortably the tightest recorded, holding a 4,571.82 to 4,614.59 range so far today against a settled 4,594.68 Thursday close. The higher low read is the best supported call on the board this morning, and it has independent corroboration that was arrived at separately: a third party technical desk published its overnight note at 01:07 UTC under the title “Gold Price Searches for a Higher Low.” The post-Jackson gold structure is constructive.
Here is the shape. Session highs run 4,697.66 on Tuesday, 4,674.20 on Wednesday, 4,643.35 on Thursday and 4,614.59 today, four consecutive lower highs stepping down roughly 25 to 30 dollars each. Session lows run 4,605.17, 4,582.82, 4,566.17 and today 4,571.82. So the ceiling has fallen 84 dollars in four sessions while the floor has just turned up for the first time, 5.65 dollars above Thursday’s low. That is a compression, and it is being wound into a 15:00 event with no question and answer session.
Compressions into a binary do not usually resolve gently. The post-Jackson compression is one of the tightest in recent memory.
The Financial Times noted that Warsh’s speech gave a crisper picture of how he reads the economy but left open questions over the Fed’s “reaction function” . For gold, this ambiguity is a double-edged sword: the post-Jackson uncertainty is both supportive and risky.
What changed. Gold took the most hawkish day of the month and did not break. Thursday’s low of 4,566.17 was the lowest print since 21 August and it came on a session in which Hammack said now is the time to act and Schmid put a 16 September hike on the table, while the dollar index reached an eight day high. Gold closed 4,594.68, one dollar above Wednesday’s close, and is roughly eight dollars higher again now, having been seventeen higher at 09:15. A market that absorbs that supply and closes green is not a market that is finished. The post-Jackson resilience is a bullish signal.
Note the quote page and the settled series disagree on Thursday’s close, 4,601.89 against 4,594.68, because they cut at different times. This page uses the settled figure and names the difference rather than hiding it.
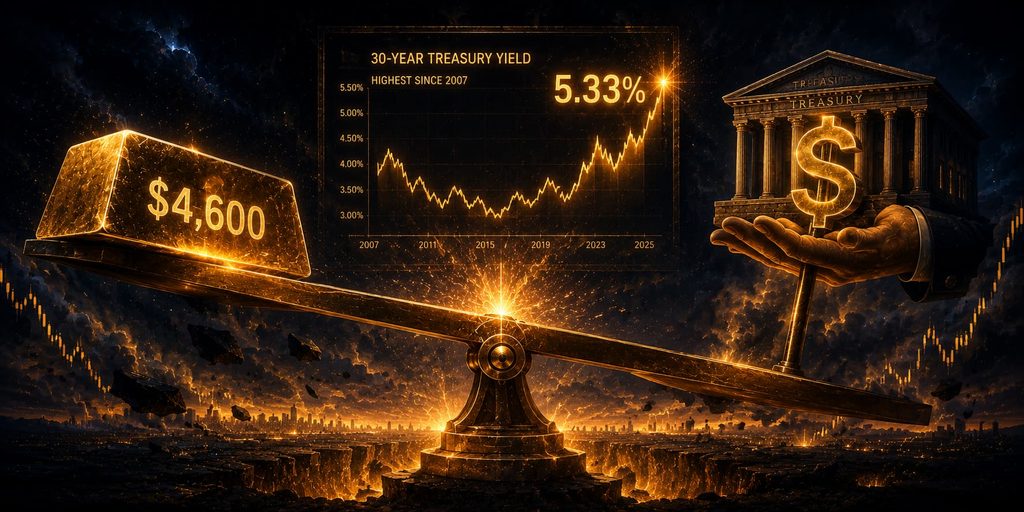
Main driver. The same one that has driven this since 19 August. The dollar is being priced off the Treasury rather than the Federal Reserve, so gold is trading fiscal arithmetic rather than the funds rate. Treasury at least doubles its long end buybacks from 9 September while auction sizes stay unchanged, possibly funded from a Treasury General Account that closed at 935 billion on 20 August, against a July federal deficit of 432.3 billion and a 30 year yield at 5.204 that printed 5.33 on 18 August, the highest since 2007.
Underneath all of it is official demand that does not trade the news: central banks bought a record 289 tonnes in the second quarter and the People’s Bank of China added roughly 20 tonnes in July to 2,366 tonnes, a twenty first consecutive month and the longest run on record. The post-Jackson gold demand remains robust.
What we are watching. Not the Fibonacci ladder, and this is a change of practice. The third party anchors have now moved five sessions running. Yesterday they ran 3,948.50 to 5,601.87 with the 50 per cent at 4,775.19; three sessions earlier the same vendor anchored 3,948.50 to 5,413.22 with the 50 per cent at 4,680.86. That is a 94 dollar swing in one published level with no price action between the reads to justify it, so we are quoting traded prices instead and naming the ladder only as a moving object.
What has actually turned this market is 4,700, twice, without price ever reaching it: 4,697.66 on Tuesday and 4,674.20 on Wednesday. What has actually held it is 4,566 to 4,583. Those two are the real edges of the compression and they are 110 dollars apart. The post-Jackson gold levels are clear and actionable.
For more on how the dollar moves gold, see our guide on how the dollar moves gold.
Post-Jackson Dollar Index: The Squeeze Inside the Downtrend
The dollar index is 99.18 and 99.182 across two sources, effectively the same print, holding a 99.10 to 99.24 range so far today against a settled 99.16 Thursday close. The structural read is that the dollar has caught a bid inside a broader downtrend, that it is pulling back into the liquidity it broke, and that a retest into that supply produces a lower high and resumes the move down. That map is right and it is the map we have been running since 19 August. The post-Jackson dollar structure is a squeeze within a downtrend.
Two things in the brief need correcting before anyone trades off it. First, the retest is not happening at 99.50. Our own published liquidity band runs 99.40 to 100.21 and price has not been within twenty ticks of its lower edge all week. The level actually being retested is 99.222, the 61.8 per cent retracement of the move from the 97.628 war era low to the 101.801 high of 24 June, and the 200 day average on the day the index broke below it.
Second, the lower high has not formed. Thursday went the other way: the settled series has 99.12 open, 99.26 high, 99.07 low, 99.16 close, and 99.26 is above Wednesday’s 99.23. Session highs run 99.06, 99.12, 99.23, 99.26. The post-Jackson dollar pivot is 99.222.
What is live right now is that today’s high of 99.24 sits just two ticks beneath Thursday’s 99.26, and it got there by tagging the 99.222 pivot for a third time. The margin was five ticks at 09:15 and it is two now. If it still holds into the close, today is the lower high, and it needs a close beneath 99.07 to mean anything at all. The post-Jackson dollar is at a critical juncture.
What changed. Day one of Jackson Hole was hawkish and the dollar took it. Three Federal Reserve officials warned on Thursday that inflation is too high. Beth Hammack repeated her call for higher rates and said “I believe now is the time to act”, noting inflation has run above target for more than five years and that financial conditions show no sign of restriction. Jeff Schmid said policy at 3.50 to 3.75 per cent may be accommodative rather than restrictive and put a 16 September hike explicitly on the table.
The index rose 0.21 per cent on the session to its highest level since 19 August, which is the day it broke down. The curve came with it: 2 year 4.232, 10 year 4.686, 30 year 5.204, the long end higher again than yesterday morning’s 4.22, 4.65 and 5.17. So unlike Tuesday, this pullback now has a reason behind it, and that is worth respecting rather than dismissing. The post-Jackson dollar move has hawkish Fed speakers behind it.
Main driver. The driver is still the long end and the fiscal arithmetic rather than the funds rate. Treasury at least doubles the size of its long end buyback operations from 9 September, taking the 10 to 20 and 20 to 30 year nominal sectors from a 2 billion dollar maximum to at least 4 billion per operation and running to the 4 November refunding, with Scott Bessent saying operations could run larger still and that the signal is deliberate because yields do not reflect the underlying fundamentals.
It may be funded from the Treasury General Account, which closed at 935 billion on 20 August. Auction sizes are unchanged. The July federal deficit was 432.3 billion, the largest month since March 2021, with the fiscal year to date near 1.8 trillion. The 30 year printed 5.33 per cent on 18 August, the highest since 2007.
What we are watching. 99.222, for a fourth consecutive session, and now the shape of the rejection rather than the level itself. Two tags, two closes back underneath, and the highs still rising each day. Immediately above it an independent 200 period average sits at 99.308, so 99.22 to 99.31 is a nine tick band that has to be cleared on a close before the 99.40 to 100.21 zone is even live. The daily 200 average has itself declined to roughly 99.12 to 99.15, so price is sitting on it this morning.
Beneath, 99.07 is Thursday’s low and it is the first thing that has to break for the lower high read to start paying. The post-Jackson dollar level to watch is 99.222.
Post-Jackson EUR/USD: Coiling into the 200-Day
EUR/USD is 1.1645 and 1.16457 across two independent sources, effectively the same print, holding a 1.1639 to 1.1656 range so far today against a settled 1.1654 Thursday close. The read is higher lows on the higher time frame for continuation upward, and the honest answer has two halves that pull in opposite directions. On the swing chart the read is right and the number is 1.1576 on 18 August against 1.1637 on 27 August, a higher low with sixty one pips of room.
Inside this week it is not: the lows have stepped down three sessions running at 1.1651, 1.1642 and 1.1637, each one a deeper probe into the 1.1631 to 1.1649 band published for nine sessions, and each one closed back above the top of it at 1.1675, 1.1651 and 1.1654. So the floor is doing its job and the rallies are not. Highs run 1.1680, 1.1678, 1.1660 and this morning 1.1656. Falling highs on a held floor is a coil, and this one is being wound directly into a 15:00 event. The post-Jackson euro is coiling.
Re-read at 11:45: the session low has since extended to 1.1639, which is only two pips above Thursday’s 1.1637, not the five it was at 09:15. The higher low is still there and it is thinner than it was. Forming, not formed.
What changed. The euro gave back nothing of consequence, and on this particular Thursday that is the information. The pair opened 1.1651, ran to 1.1660, was pushed to 1.1637 and closed 1.1654, a three pip net gain on a session in which three Federal Reserve officials called for tighter policy and the dollar index reached an eight day high. A pair that will not break on that news is telling you something about how it is positioned. The post-Jackson euro resilience is notable.
What has not changed is the reason to own it: money markets price roughly 40 basis points of further European Central Bank tightening by year end with a September hike largely anticipated, and Isabel Schnabel has said rates might rise further if Middle East tensions persist. The euro therefore carries one confirmed hike and a conditional second, and the condition is geopolitical.
For more on how to prepare for high-impact data, see our guide on how to prepare for high-impact data.
Post-Jackson GBP/USD: Broke the Shelf, Trend Intact
GBP/USD is 1.3590 on both sources, holding a 1.3580 to 1.3599 range so far today against a settled 1.3598 Thursday close. This is the page where the brief needs the most work, and the split is the same as the euro but wider. On the swing chart the higher low read is intact and comfortable: 1.3526 on 18 August has not been touched and the 200 day average at 1.3431 is 158 pips away and irrelevant this week. The post-Jackson cable structure is still constructive.
Inside this week the tape has done the opposite. Session highs run 1.3660, 1.3658, 1.3657, 1.3604 and this morning 1.3599, a clean sequence of lower highs. Session lows run 1.3615, 1.3619, 1.3583, 1.3569 and today 1.3580, which is lower lows until today. Thursday’s 1.3569 was the lowest print since 20 August. So the first higher low of the week is hours old, it is unconfirmed, and it is forming beneath a shelf the pair broke on Wednesday. 1.3618 was support, it is resistance now, and it has not been reclaimed on a close in two sessions. The post-Jackson cable broke a shelf.
What changed. Thursday was a recovery that earned nothing. Cable was pushed to 1.3569 in the London session and closed 1.3598, a four pip net gain, having failed at 1.3604 on the way back. That is a pair which stopped falling without starting to rise. None of it was domestic: the United Kingdom calendar is empty until the Monetary Policy Committee meets on 17 September, so every pip this week has been American, and Thursday’s specifically was three Federal Reserve speakers talking about hikes while the dollar index reached an eight day high. The post-Jackson cable is driven entirely by the dollar.
Main driver. The Bank of England is not driving this and it is worth being explicit, because the temptation with a pair that was at a six month high last week is to invent a domestic story. Bank Rate is 3.75 per cent after a 6 to 3 hold on 30 July in which the three dissenters wanted a hike, and the Committee does not meet again until 17 September. Markets still price at least 25 basis points of tightening by year end after July inflation accelerated to 2.9 per cent from 2.6.
But that rise was a 14.7 per cent gas move following the Ofgem cap increase rather than wages, and services inflation actually eased to 3.4 per cent.
The labour data is the soft spot and it is softening: unemployment 4.9 per cent, payrolled employees down 78,000 year on year, vacancies 707,000, headline regular pay 3.5 per cent but private sector regular pay only 2.8 per cent. That 2.8 is the number the hawks need and it is falling. The pound is carried by a rate expectation its own data is quietly undermining, against a dollar being priced off Treasury issuance. The post-Jackson cable is a dollar story.
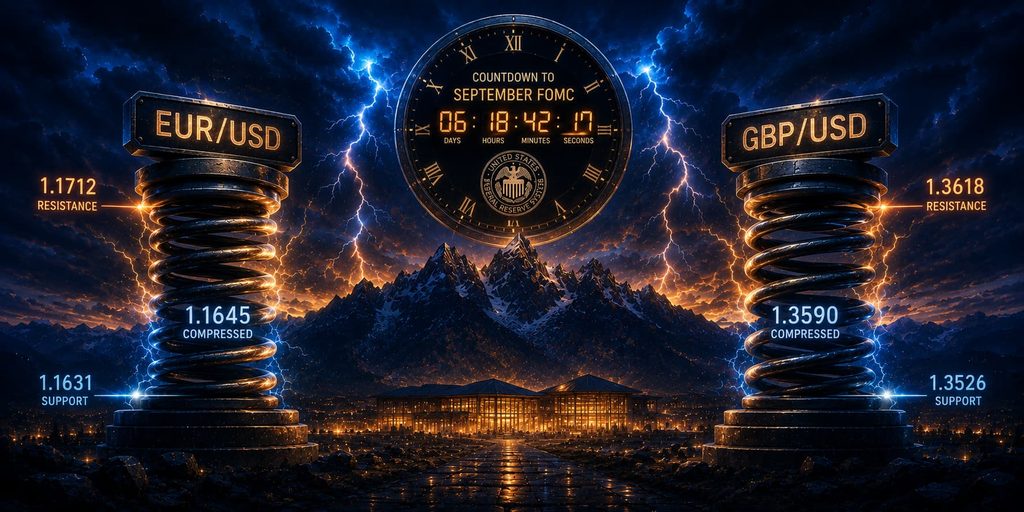
What we are watching. 1.3618, from the wrong side, for a third session, and the 50 period average at roughly 1.3599 which price has been pinned to within a pip or two for three days and which is exactly this morning’s high. Those two numbers frame the whole repair job: reclaim 1.3599 on a close and the pair is back at the shelf, reclaim 1.3618 on a close and the break is repaired.
Beneath, the sequence that keeps the structure alive runs 1.3569 which is Thursday’s low and the base of this morning’s higher low, then 1.3549 where a 100 period average sits, then 1.3526 which is the 18 August low. The honest reassurance on this page is that the trend backdrop is completely intact and what has broken is a short term shelf, not the structure. The post-Jackson cable remains a trend inside a consolidation.
Key Levels Summary
| Instrument | Support | Resistance | Current |
|---|---|---|---|
| DXY | 99.07, 98.90, 98.86, 98.521 | 99.24, 99.31, 99.41, 99.71 | 99.18 |
| Gold | 4,571, 4,566, 4,525, 4,508 | 4,614, 4,643, 4,674, 4,700 | 4,602 |
| EUR/USD | 1.1639, 1.1637, 1.1631, 1.1576 | 1.1656, 1.1660, 1.1678, 1.1712 | 1.1645 |
| GBP/USD | 1.3580, 1.3569, 1.3549, 1.3526 | 1.3599, 1.3604, 1.3618, 1.3665 | 1.3590 |
The Week Ahead: Post-Jackson Catalysts
The Jackson Hole aftermath will continue to be digested into next week. The post-Jackson calendar is loaded with key events:
- Monday: German flash inflation – the first read on European price pressures
- Tuesday: Euro area flash inflation – ECB’s key input for September
- Thursday: ECB meeting – rate decision and guidance
- 15-16 September: FOMC with updated projections – the main event
- 17 September: Bank of England meeting – MPC decision
The September Fed pricing runs 30 to 38 per cent for a hike across vendors before the speech, but according to the CME FedWatch tool, hike probabilities surged to 57-60% in the immediate aftermath of Warsh’s hawkish tone. The post-Jackson market will need to reconcile this repricing with the actual data.
The post-Jackson landscape is defined by a single question: what does the Fed actually do in September? The answer remains unclear, but the data and the speeches have drawn clearer lines around the debate. The Jackson Hole aftermath has given us a more defined range for every major asset.
The post-Jackson week ahead will be defined by how markets interpret the conflicting signals from the Fed, the Treasury, and the data. The post-Jackson trading environment is one of elevated volatility and compressed ranges.
Disclaimer
This article is for educational and informational purposes only. It does not constitute financial advice, trading recommendations, or an offer to buy or sell any asset. Trading forex, commodities, indices, cryptocurrencies, and futures carries significant risk and may not be suitable for all investors. You can lose more than your initial deposit. Past performance does not guarantee future results. Always read full terms, contract specifications, and risk disclosures before trading. Do your own research. Consult a licensed financial advisor if you need professional investment advice.