


The Week in Review
The dollar spent Wednesday on the back foot, giving ground against most majors after a softer-than-expected U.S. producer price report cooled bets on a near-term Fed rate hike. The Dollar Index dropped toward a low near 100.36 by early afternoon before stabilizing near 100.51 for a loss of around 0.4%.
The S&P 500 finished up around 0.4%, ending near 7,569 for a second consecutive daily gain. Price traded in a tight band through Asian and London sessions before pushing to a session high near 7,581 in the first hour of U.S. cash trade. The VIX collapsed more than 5% to 15.03, signaling a low volatility regime that typically supports risk assets.
The Nasdaq 100 added 0.33%, with the AI bid holding firm through a Bernanke headline that briefly knocked sentiment. The Dow gained 0.29%, showing cyclical participation in the rally. The MOC imbalance came in at $1.6bn buy-side on the S&P 500, a clear signal of institutional demand into the close.
Brent crude settled near 85.01 and WTI near 79.74, both up more than 11 percent on the week, marking the strongest week for oil since late April. The escalation in the Gulf drove the move, with the US conducting its sixth straight night of strikes on southern Iran and Iran retaliating against US facilities across the Gulf states.
The 10-year Treasury yield held at 4.55%, reflecting the oil-led inflation repricing that has quietly built through the week. Gold broke below the 4,000 handle, losing the level that had held for months.
For more on [how geopolitical risk moves oil], the desk’s framework for reading war premiums through the energy channel.
The Dollar Refused to Sell
In a textbook risk-on regime, the dollar sells. Capital rotates out of the reserve-currency shelter and into growth-sensitive assets. The equity rally, the VIX crush, and the cyclical bid across markets should have weighed on the dollar.
It didn’t happen.
The dollar index held its ground. The dollar wasn’t strong; it just wasn’t weak. And “not weak” is a positioning tell. The rate differential didn’t move. The dollar’s carry advantage stayed intact. Traders who expected a dollar sell-off on the risk-on tape were left watching the index refuse to break.
This is significant because it signals that the market is not fully convinced the risk-on regime is sustainable. The dollar’s resilience in the face of equity strength suggests underlying caution. Positioning is light, and the market is waiting for confirmation one way or the other.
The desk reads this as a constructive signal for the dollar index: when the dollar doesn’t sell on a risk-on tape, it tends to rally when risk appetite eventually fades.
What Moved the Tape
PPI Cooling: The headline Producer Price Index cooled to 5.5% year-over-year versus 6.3% forecast, with the monthly figure turning negative. That knocked the dollar lower and lifted stocks, but the move faded quickly as the market recognized the backward-looking nature of the data.
Bank of Canada Holds: The BoC held its policy rate at 2.25%, matching expectations. The loonie’s reaction stayed contained, with USD/CAD holding near 1.37.
Bernanke Joins Anthropic: The former Fed chair joined the AI company’s advisory board, a signal of AI legitimacy that briefly lifted tech names. The Nasdaq 100 responded positively, though the move was muted in the broader context of the war escalation.
Positioning Flow: The $1.6bn MOC buy-side imbalance on the S&P 500 was the heaviest of the week, indicating institutional demand into the close. This supported the equity rally but did not translate into dollar weakness.
The Dollar Index Refuses to Break: Despite the equity bid, the dollar index held its levels. This is the story of the session and the week.
Desk View: Dollar Structure Remains Constructive
The dollar index is choppy and still consolidating, and the desk is comfortable with that. Structure has not changed: DXY is holding a series of higher lows through July, sitting above a rising 50-period average near 99.89, and the index is firmer on the session at about 100.78 as oil-led inflation fear lifts US yields.
A softer weekly close would not break that read; a pullback inside an uptrend is what a higher low looks like while it is forming. The desk’s core view is unchanged and now has the tape behind it: the market is underpricing the hawkish tail, and the escalation in the Gulf is the reason.
Sixth straight night of US strikes on southern Iran, Iran firing back at US facilities across the Gulf states, and a US blockade turning ships away in the Gulf of Oman. Oil has done the rest. The desk still expects the dollar index to break higher out of this range as the inflation trade takes hold.
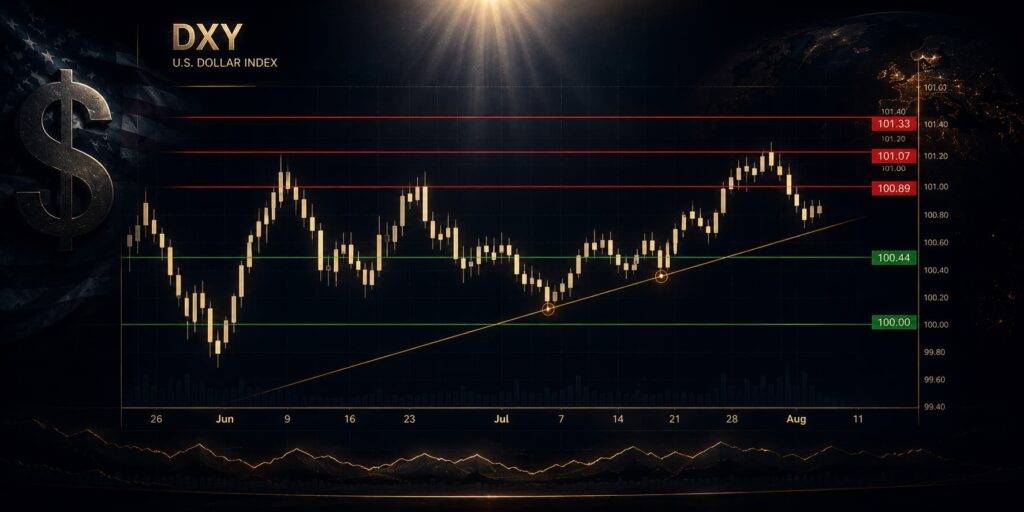
The desk notes that positioning is light. Leveraged funds have not built a large long in the dollar index. This means there is room for buying pressure to emerge, which would amplify a breakout higher. The desk is positioned for that scenario.
For more on [how the dollar moves gold], the desk’s framework for reading gold through the dollar channel.
What Changed This Week
The war escalated again overnight. US strikes hit the Bandar Abbas railway junction, the Giriveh Bridge and further bridges around Bandar Khamir, plus Iranshahr airport, a sixth consecutive night, with Iranian state media reporting seven killed. Iran retaliated against US facilities in Bahrain, Kuwait, Qatar and Jordan. The US redirected three commercial vessels in the Gulf of Oman and disabled one.
Brent is about 85.01 and WTI about 79.74, both up more than 11 percent on the week, the strongest week since late April.
This escalation has moved the dollar index in a way that pure economic data could not. The war premium is now embedded in oil and, through oil, in the dollar. The desk reads the pass-through as arriving in the July and August data, which is where the hawkish repricing lives.
Gold lost the 4,000 handle. The metal that had defended the level through multiple tests finally gave way as real yields rose and the dollar held firm.
Sterling had its story earlier in the week on the fiscal relief trade, but that bid has faded as the oil shock lands on Britain’s energy-importing economy.
Main Driver: Oil and the Inflation Trade
Oil. The June inflation prints were soft, and that is what the market has been trading, but they are backward-looking energy base effects that cannot see a Hormuz supply shock landing in real time. The desk reads the pass-through as arriving in the July and August data, which is where the hawkish repricing lives.
The dollar index is the cleanest expression of this trade. When oil rises on supply fears, it lifts inflation expectations, which firms US yields relative to the rest of the world. That pulls capital into the dollar index.
The desk notes that the oil move has been driven entirely by the geopolitical premium. Global demand estimates have not changed. Inventories have not tightened. The price is up on supply risk, not on demand strength. This means the move can reverse quickly if the war de-escalates, but for now, the risk premium is real and growing.
The Iran escalation is the single most important factor for the dollar index going into the weekend. The desk is watching the war tape closely. Any escalation over the weekend would likely gap the dollar index higher on Monday open.
What the Desk Is Watching Into the Weekend
The war tape into the weekend. This has the feel of a calm before the storm: positioning is light, headlines reprice intraday, and the escalation is running in one direction. Oil is the transmission line. If crude extends, the inflation trade takes over and the dollar index is the cleanest expression of it.
FOMC on 28 to 29 July and Chair Warsh’s tone are the scheduled risk. The desk expects the Fed to hold, but the tone of the statement will be critical. If Warsh acknowledges the oil-led inflation risk, the dollar index could rally sharply.
The China slowdown is the other macro factor. GDP grew just 4.3% YoY in Q2, the slowest pace since Q4 2022. This is a drag on global growth and risk appetite, which typically supports the dollar index through the haven channel.
For more on [how to prepare for high-impact data] (path: /guides/forex-trading-during-major-events-and-news/), the desk’s process for framing FOMC risk.
DXY Key Levels
Resistance
| Level | Description |
|---|---|
| 100.89 | daily pivot P + 21 EMA H4 + prior day high |
| 101.07 | pivot R2 + 20 SMA daily |
| 101.33 | pivot R3 + prior week high + round 101.5 |
Support
| Level | Description |
|---|---|
| 100.44 | pivot S2 + prior week low + prior day low |
| 100.00 | 50 SMA daily + round 100 + pivot S3 |
What would invalidate the view: Holding 99.89 to 100 keeps the higher-low structure and the bullish read intact. A decisive loss of 99.89 breaks the sequence of higher lows and the desk stands down from the breakout call until it is rebuilt.
The 100.00 level is psychological support that has held multiple tests. A break below it would signal a shift in sentiment and likely accelerate selling. The desk would stand aside until structure rebuilds.
Macro Backdrop: China Slowdown Deepens
Cross-asset tape reads risk-off (dollar bias neutral, vol elevated). Driver in the feed:
“China’s economic slowdown is deepening: China’s GDP grew just +4.3% YoY in Q2 2026, the slowest pace since Q4 2022 and below the government’s official target range of +4.5% to +5.0%. This followed +5.0% expansion in Q…” — Kobeissi Letter
This is the quiet undercurrent of the week. The China slowdown is a drag on global risk appetite and commodity demand. For the dollar index, the China story matters through two channels:
- Risk-off flows into the dollar – When global growth slows, capital tends to rotate into the dollar as the world’s reserve haven.
- Commodity price pressure – China is the world’s largest commodity importer. A slowdown there weighs on oil and metals, which typically supports the dollar through lower real yields.
The desk notes that the China data is backward-looking. The market has not fully priced the second-order effects of a sustained slowdown. This is a risk into the back half of the year.
GBP/USD: Cable Fades as Oil Hits Sterling
Cable is about 1.3440, chopping inside the range that has contained it, and the desk reads the rallies the same way it reads the euro’s: to be sold. Sterling had its story earlier in the week on the fiscal relief trade, and the desk respected it, but that is a domestic bid running into a macro tide moving the other way.
Britain imports its energy too, and with Brent up more than 11 percent on the week and the Gulf escalating nightly, the terms-of-trade hit lands on the pound alongside the euro. Against that sits a dollar index holding higher lows with the inflation trade turning in its favour.
The desk and the macro desk family see the vulnerability on the same side here: so long as this war escalates into the weekend, strength in cable is something to fade rather than follow.
Key Levels
| Level | Price | Description |
|---|---|---|
| Resistance | 1.3475 – 1.3550 | Recent swing highs |
| Support | 1.3370 | First real shelf |
What would invalidate the view: A sustained push above 1.3550 drops the fade read. Losing 1.3370 confirms it and puts 1.32 in play.
The desk is watching whether 1.3475 to 1.3550 keeps capping. Below, 1.3370 is the first real shelf and the level that tells you whether this is a range or the start of a leg lower. FOMC on 28 to 29 July is the scheduled risk that could break the pattern.
Gold: Breaks Below $4,000 as Real Yields Rise
Gold broke the 4,002 zone and the lower line of its 4-hour symmetrical triangle, trading near 3,981 to 3,994 and holding below 4,000 into the London session, an eight-month low.
The war escalated for a sixth straight night, but gold did not bid on any of it.
Why Gold Didn’t Bid
Real yields and the dollar index, not fear. Oil-led inflation expectations are lifting US yields and firming the dollar, which raises the opportunity cost of holding a non-yielding asset. The war is bullish oil and, through oil, bullish the hawkish tail, which is bearish gold. That is why the haven bid never showed.
Gold has no yield and no earnings, so it is priced off the opportunity cost of holding it. Three forces set that cost:
- Real US yields – When real yields fall, gold firms. When they rise, gold struggles.
- The dollar index – A firmer dollar makes gold more expensive for the rest of the world.
- Central bank demand – Steady buying that has underwritten the market through the 2020s.
The current move is driven by the first two forces: real yields rising and the dollar index holding firm. The war is bullish oil, which lifts the dollar index through the hawkish inflation channel, which is bearish gold.
Key Levels
| Level | Price | Description |
|---|---|---|
| Resistance | 4,000 | Now resistance, the line to reclaim |
| Support | 3,890 | Next named shelf |
What would invalidate the view: A decisive reclaim of 4,000 and a hold above it puts the breakdown in question and the desk steps back. While price stays capped below 4,060 the bearish read stands.
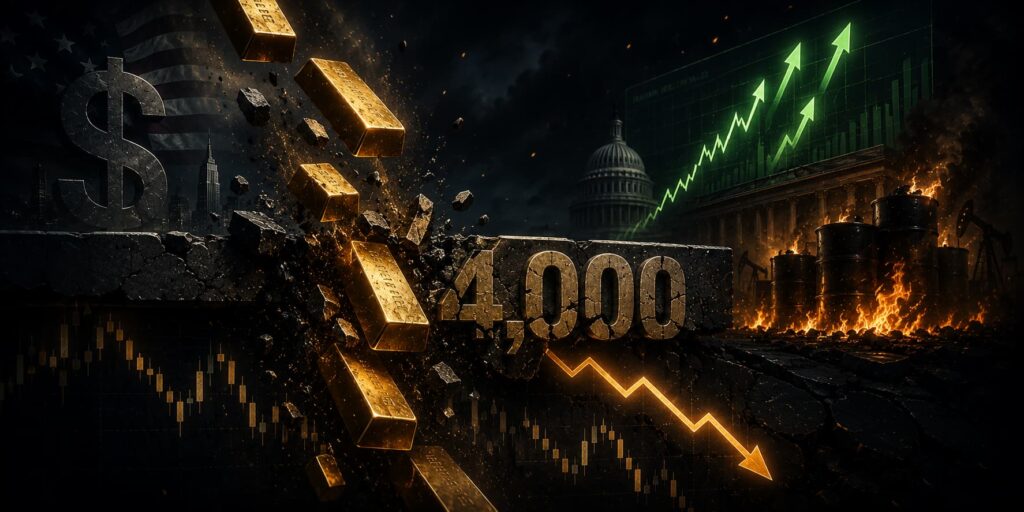
The desk is watching whether 4,000 now caps on a retest. A rejection from underneath would confirm the shelf has flipped from support to resistance. The war tape into the weekend is the wildcard: a genuine supply event is the one thing that could force a haven bid back into the metal.
What Actually Moves the Dollar Index
The dollar index, DXY, measures the US dollar against a basket of six major currencies, and the euro alone is more than half of that basket. So the index is really a rate and risk story.
It firms when the market expects the Federal Reserve to hold rates higher for longer relative to the other central banks, and when global risk appetite sours and capital runs to the dollar as the world’s reserve haven. It softens when the Fed is expected to ease faster than its peers, or when risk appetite is strong and money leaves the dollar for higher beta assets.
Two forces sit underneath that:
- Real US yields – the Treasury yield after inflation, which set how much you are paid to hold dollars. Rising real yields pull capital in and lift the index; falling real yields do the opposite.
- Relative growth and policy – the dollar is always priced against someone else, so a weak euro area or a dovish ECB can lift DXY even when nothing has changed in the US.
The desk reads the index as the Fed path minus the rest, adjusted for where global risk sits.
Why the Dollar Is the Centre of Gravity
Almost every other market is quoted against the dollar or funded in it, so the index is the single most important macro read on the board. A firmer dollar is a headwind for gold, for the dollar-priced commodities and for the FX majors; a softer dollar tends to lift them.
That is why the desk reads DXY first and the individual pairs second: much of what looks like a move in EUR/USD, GBP/USD or gold is really a dollar move wearing a different label.
The dollar index is also a funding currency. The carry trade, where investors borrow dollars to buy higher-yielding assets, is one of the largest single sources of global liquidity. A firmer dollar index tightens funding conditions, which can weigh on risk assets. A softer dollar index loosens funding, which tends to lift risk.
This is why the dollar index matters beyond just the currency markets. It is a global liquidity gauge.
How the Desk Reads the Chart
DXY trends in long, persistent moves punctuated by sharp corrective pullbacks, so the level map matters more than any single candle. The near term bias stays firm while the index holds its nearest defended support and the run of higher lows is intact, and it turns cautious when a support that held several times finally breaks on a closing basis.
The named levels in the live block come from a six lens confluence scan, prior day and weekly extremes, round numbers, moving averages, pivots and the volume point of control, not from a single indicator.
None of this is a trade instruction. It is a map of where the market has shown it cares, so you can frame your own plan and your own risk.
Conclusion: The Set-Up Into FOMC
The dollar index is at a critical juncture. The higher-low structure is intact, the hawkish repricing is building through the oil channel, and the escalation in the Gulf shows no signs of de-escalating.
The desk sees three possible paths:
- Breakout higher – If oil extends and inflation expectations rise, the dollar index breaks above 101.50 and trends higher into FOMC.
- Range-bound consolidation – If the war stabilizes and oil pulls back, the dollar index holds 100 to 101 and waits for FOMC for direction.
- Breakdown lower – If the war de-escalates and risk-on flows return, the dollar index breaks below 99.89 and the higher-low structure is invalidated.
The desk is positioned for scenario one, but watching the war tape closely.
The traders who make the transition successfully are not the ones with perfect forecasts. They are the ones who understand the structure and manage their risk around the levels.
Disclaimer
This article is for educational and informational purposes only. It does not constitute financial advice, trading recommendations, or an offer to buy or sell any asset. Trading forex, commodities, indices, cryptocurrencies, and futures carries significant risk and may not be suitable for all investors. You can lose more than your initial deposit. Past performance does not guarantee future results. Always read full terms, contract specifications, and risk disclosures before trading. Do your own research. Consult a licensed financial advisor if you need professional investment advice.