


Identifying and following market trends is essential for successful trading. Using multiple timeframes can help you see the bigger picture while also spotting precise entry and exit points. Longer timeframes are used to define the overall trend, while shorter ones help refine trading decisions. Relying on just one timeframe can lead to missed opportunities or false signals, so combining different perspectives provides a clearer and more balanced view of market movements.
This guide covers everything you need to know about trading multiple timeframes. You will learn the top-down approach, how to choose the right timeframes, and the common mistakes to avoid. Mastering multiple timeframes is one of the most important skills a trader can develop.
For a deeper look at [support and resistance levels], this guide covers how multiple timeframes help identify key levels.
Key Takeaways
- Using multiple timeframes in trading helps identify trends and refine entry and exit points
- Traders should choose a primary timeframe and use longer and shorter frames for context and precision
- Longer timeframes provide reliable signals, while shorter frames help confirm and refine trades
- The strategy enhances understanding of market trends and instills confidence in trading decisions
- Multiple timeframes can highlight conflicting trends, aiding traders in avoiding potential pitfalls
What Is a Multiple Timeframe Analysis?
As a price action trader, multiple timeframes analysis fits my trading style perfectly. By offering an unbiased, overall picture, it builds an equilibrium point between different time perspectives.
Like it or not, timeframes have different importance in the day-to-day market analysis. For instance, what is the one-minute chart telling you? Or, more precisely: does it offer meaningful information? How about the hourly? Or the four-hour, daily, weekly or monthly?
Before compiling all the information together, in a true multiple timeframes analysis, we need to understand the different timeframes and their importance.
Understanding multiple timeframes is essential because markets exist in several timeframes simultaneously. There can be conflicting trends within a particular stock depending on the timeframe being considered. It is not out of the ordinary for a stock to be in a primary uptrend while being mired in intermediate and short-term downtrends.
Typically, beginning or novice traders lock in on a specific timeframe, ignoring the more powerful primary trend. Alternately, traders may be trading the primary trend but underestimating the importance of refining their entries in an ideal short-term timeframe.
Default Timeframes Offered by the MT4 Platform
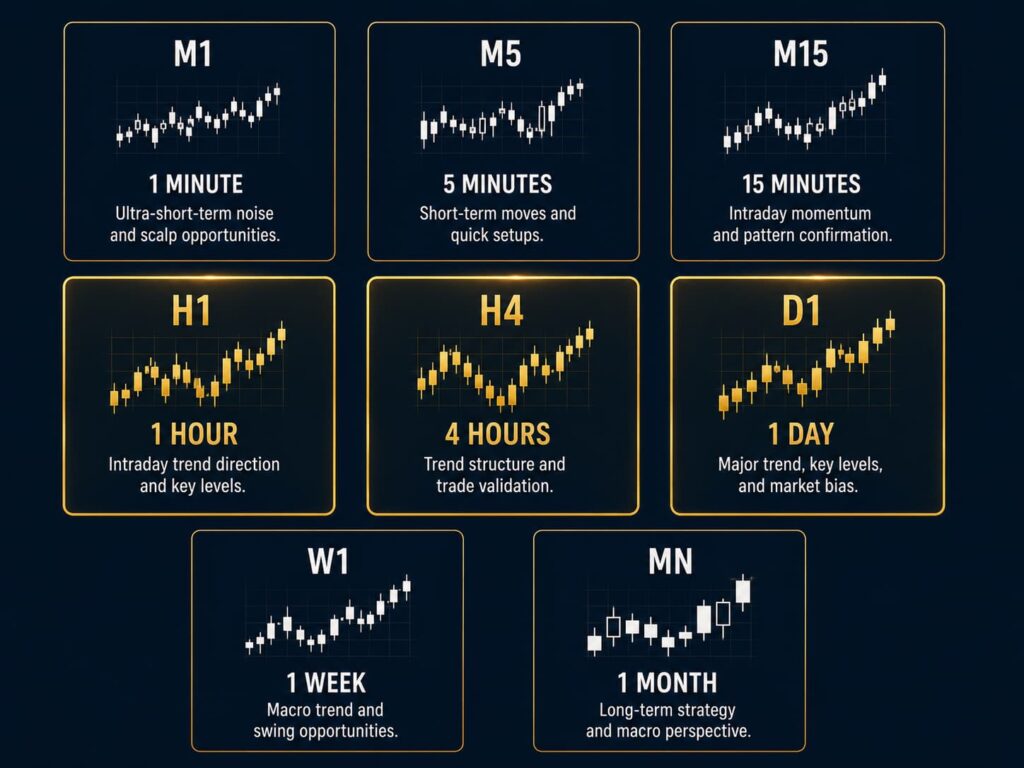
The MT4 or the MetaTrader 4 platform comes with the following standard timeframes by default:
- M1 – one-minute chart
- M5 – five-minute chart
- M15 – fifteen-minute chart
- M30 – thirty-minute chart
- H1 – hourly chart
- H4 – four-hour chart
- D1 – daily chart
- W1 – weekly chart
- MN – monthly chart
All of them are important for different stages of a multiple timeframes analysis. However, depending on the trading platform, traders have access to other timeframes too.
For instance, the M2 (two-minute chart) or H2 (two-hour chart) exist, and some traders use them when doing technical analysis. As always, keeping things simple helps.
M1 – The One-Minute Chart
As a rule of thumb, every trading platform that starts with the letter “M” offers short to very-short-term market information. Therefore, scalpers value highly this information in their trading strategy.
The M1 chart is irrelevant from a multiple timeframes analysis point of view. At best, traders use it for scalping their way during illiquid trading sessions. Asian traders love it. Because the Forex market stands still most of the Asian sessions, traders active during the Asian session have a hard time catching swing trades.
As such, they move to the lower timeframes like M1 and use oscillators to buy the lows and sell the highs of the session. Because the Asian session ranges so much, the probabilities favour an overbought/oversold approach using oscillators.
One drawdown of using such an approach is the increased risk. Traders pile on a position forced by the tight ranges. Hence, they increase the risk while only a small move against them proves fatal.
From a multiple timeframes analysis perspective, M1 is useless for the inexperienced. All timeframes that start with the letter “M” share the same risk and provide little or no information as to where the market actually goes. A true multiple timeframes analysis starts at the H1 chart.
H1 – The Hourly Chart
A true multiple timeframes analysis is a top-bottom, not a bottom-up analysis. As such, it begins with the highest timeframes possible and goes lower to the smaller ones. And yes, it preferably stops at the hourly chart.
Anything below the hourly chart is noise from a multiple timeframes analysis perspective.
Coming back to the H1 chart, it is one of the most important timeframes of them all. The answer comes from its simplicity, as brokers cannot alter that much the information provided.
Different servers around the world show different information on almost all bigger timeframes. Candlesticks simply start at different times. For instance, a broker having the servers on a GMT+2 location will have the H4 candlestick opening and closing at different times than one having the servers on a GMT location.
Now, this is an important aspect of trading multiple timeframes. Imagine you trade simply from a technical analysis perspective. As such, opening and closing prices are vital. With different information on different brokers, different results appear.
So why is then the H1 chart so important? Well, you cannot do much to alter a sixty-minute chart. An hour is an hour around the globe: it starts at the top of the hour and sixty minutes later the candlestick closes.
H4 – The Fixing Timeframe
The solution to the problem listed above is to use the same server time on all of your multiple timeframes analysis. Simply ask the broker to provide you with the right charting info. You will be surprised how many will refuse that. The best charting info comes from the GMT timeframe. Pure and simple, the GMT pricing is the unaltered one.
The H4 on a GMT pricing shows one crucial piece of information: the daily, weekly, and monthly fixings. For those not familiar with the concept, every four hours during the day, the clearing on futures markets results in a rise in volatility on the spot market.
That increases in importance when the fix happens during London and New York common trading hours. Moreover, it is even more important when it comes at the end of the trading week. Furthermore, it is vital at the end of the trading month.
From a multiple timeframes analysis perspective, interpreting fixings on the H4 chart is crucial for seeing where the smart money interest lies. After all, the retail trading size of the FX market is so small we can simply disregard it. The key is to sit with institutional players, their interest, and focus. And that info is better seen on the H4 chart.
D1 – Now We Are Talking Money
I would always prefer the info provided by the daily chart than any other timeframe. Perhaps only the H4 during fixing times is equally as important as the daily chart.
You don’t have to take my word for it. Sit down and wait for the daily candlesticks to close for an entire week. You will notice something strange happening at the closing, and that has nothing to do with the rollover of positions. That is, again, if you use GMT prices.
The closing of such candlesticks is crucial from interpreting the future price action. Is it a Doji candle, a hammer (pin bar) or shooting star? Does it have a short or long shadow? How about the real body? Can we get any meaningful information from its size? Most of these things happen during the last moments in a daily candlestick.
Daily charts represent the frontier between investing and swing trading. Rarely swing traders look at daily timeframes, just as rare as investors look down at a daily chart.
For more on [trading psychology and discipline], this guide covers the mental discipline required for multiple timeframes analysis.
The Bigger Perspective
The weekly chart is the one I would disregard in a multiple timeframes analysis. Not that it isn’t important, but the info here is the one that has the least importance. One may say that the weekly closing matters. Yes and no. Again, brokers close the weekly price action at different times. How do you know which one is the relevant one?
But the monthly chart is a blast. So pure in the info provided that all the economic news and noise provided by the media outlets simply disappears. Suddenly, traders face the pure price information, and trading decisions become easier.
A proper multiple timeframes analysis begins with the biggest possible timeframe and ends with the smaller timeframe.
Steps for a Multiple Timeframes Analysis Strategy
First, look for your info. Regardless of the currency pair traded, search for historical data. Once again, you will have a hard time finding it. If you do find it, you will see it isn’t for free, but quite expensive.
Historical data comes in yearly charts and sometimes has secular information. For instance, if you are interested in building a multiple timeframes analysis on the GBP/USD pair, you should have historical data from the 1600s.
Second, move down with your analysis on the lower timeframes, like the monthly one. Start on the monthly where yearly ends. In the meantime, however, make sure you have GMT prices on your MT4 or whatever the trading platform used. You are going to need it later on the lower timeframes.
Third, skip the weekly chart. Instead, use the daily but zoomed out at maximum, so you can see as many candlesticks on the screen as possible.
Fourth, go on the H4 chart and use vertical lines to mark the daily, weekly, and monthly fixings. You will just say “wow” in the end, as the price action surrounding those moments is simply mind-blowing.
Finally, stop with the H1 chart. Anything below is too much noise.
Using a Multiple Timeframes Analysis Strategy
With the steps above in mind, use the same strategy on all timeframes. For instance, let’s say you trade divergences with the RSI. Simply put the RSI on all timeframes mentioned and try to interpret the market.
On the same currency pair, you may have different outcomes: bullish on H4, bearish on monthly, bullish on H1. Or the other way around. This is the reality of multiple timeframes trading.
If hedging is allowed, try taking them. If not, use different brokers: one to analyse the market and take one side, and the other one to trade the other side of the market.
The same is valid for any other trading strategy, like the Elliott Waves, and so on. Whatever strategy you use, keep one thing in mind: a multiple timeframes analysis always begins with the biggest possible timeframe and ends with the smaller timeframe.
The Top-Down Approach (Step-by-Step)
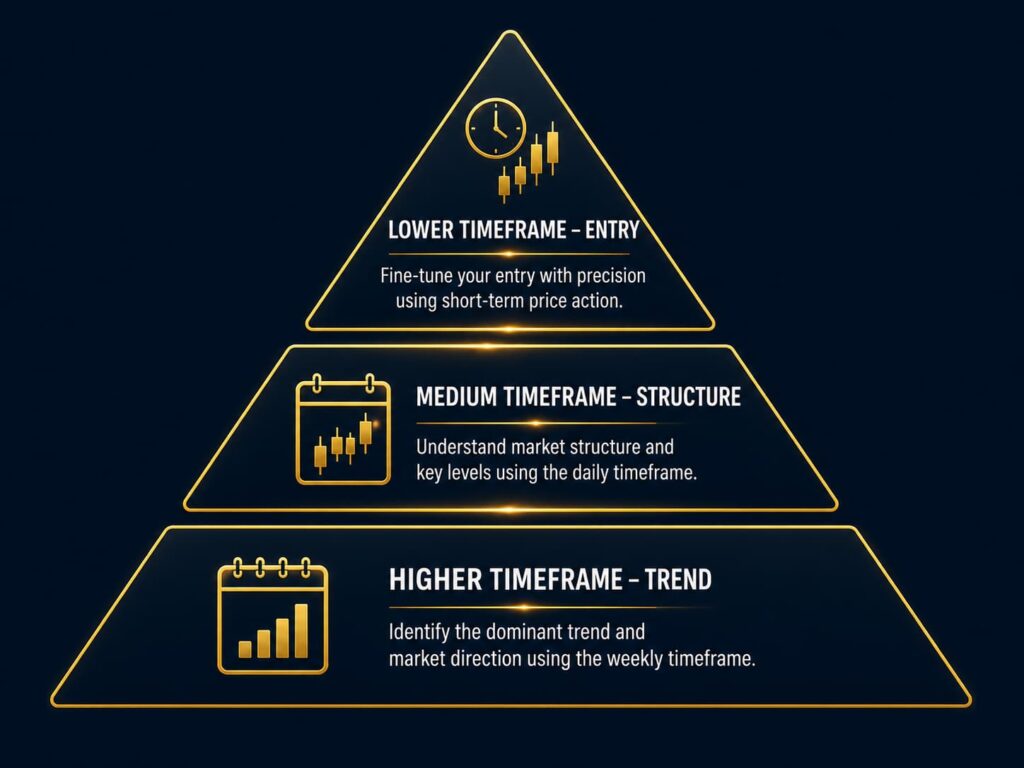
The top-down approach begins by analyzing longer timeframes first, such as monthly or weekly charts, before proceeding to daily or intraday charts. This method helps traders gain a comprehensive view of the broader market trend.
Step 1: Identify the Primary Trend
Start with the monthly or weekly chart. This tells you the dominant trend. Is it up, down, or sideways? This is the most important step in multiple timeframes analysis.
Step 2: Move to the Intermediate Trend
Move to the daily or 4-hour chart. This shows you the medium-term structure. Are there pullbacks? Is the trend healthy?
Step 3: Refine on the Shorter Timeframe
Move to the 1-hour or 15-minute chart. This gives you the precise entry and exit levels. This is where the precision of multiple timeframes analysis pays off.
Step 4: Align All Timeframes
When all timeframes agree, the trade is high conviction. When they conflict, the trade is lower conviction or worth skipping.
How to Choose the Right Timeframes
“A general rule, according to Investopedia , is that the longer the timeframe, the more reliable the signals being given.” As you drill down in timeframes, the charts become more polluted with false moves and noise. Ideally, traders should use a longer timeframe to define the primary trend of whatever they are trading.
Once the underlying trend is defined, traders can use their preferred timeframe to define the intermediate trend and a faster timeframe to define the short-term trend.
Some examples of putting multiple timeframes into use would be:
- A swing trader, who focuses on daily charts for decisions, could use weekly charts to define the primary trend and 60-minute charts to define the short-term trend.
- A day trader could trade off of 15-minute charts, use 60-minute charts to define the primary trend, and a five-minute chart to define the short-term trend.
- A long-term position trader could focus on weekly charts while using monthly charts to define the primary trend and daily charts to refine entries and exits.
The selection of what group of timeframes to use is unique to each individual trader. Ideally, traders will choose the main timeframe they are interested in, and then choose a timeframe above and below it to complement the main timeframe.
Real Example: EUR/USD Multi-Timeframe Analysis
Consider a practical example of a multiple timeframes analysis strategy using the EUR/USD forex pair. For illustration, we will use a combination of a daily chart (for identifying the overall trend) and a 1-hour chart (for defining entry and exit points).
First, we examine the daily chart. Suppose we notice a strong uptrend, with the price consistently staying above the moving average. We can then double-check with the ADX indicator. In that case, it has a value above 25, indicating a strong trend. This scenario would suggest a bullish market, and thus, we should search for buying opportunities.
Next, we switch to the 1-hour chart to find our entry point. You will notice that the price experiences dips or retracements even when it is in an uptrend. So we wait for one of these temporary dips, possibly signaled by a bearish candlestick pattern or a downward crossover in a short-term moving average.
Once we identify this dip, we can initiate a long trade, in line with the bullish trend noted in the daily chart. We also set our stop-loss below the recent swing low in the 1-hour chart to limit potential losses if the price moves against us. Conversely, we place our take-profit level near a recent high or resistance level.
In this example, you can see how the short-term timeframe exhibits more volatility or “noise” compared to the long-term timeframe. The daily chart presents a clear, steady uptrend, while the 1-hour chart displays frequent price swings within this trend. By integrating these timeframes, we can align our trades with the overall trend while leveraging short-term price movements to optimize our entry and exit points.
For more on [risk management strategies], this guide covers how to size positions when trading multiple timeframes.
Common Mistakes with Multiple Timeframes
| Mistake | Why It Is a Problem |
|---|---|
| Ignoring the higher timeframe | You miss the primary trend and trade against it |
| Trading on the lower timeframe only | You get caught in noise and false signals |
| Using too many timeframes | Analysis paralysis, conflicting signals |
| Not waiting for alignment | You enter without confirmation from higher timeframes |
| Changing timeframes mid-trade | You lose perspective and make emotional decisions |
Avoid these mistakes, and your multiple timeframes analysis will become a powerful tool.
Risk Management with Multiple Timeframes
Multiple timeframes analysis also helps with risk management. The higher timeframe tells you the direction to trade. The lower timeframe tells you where to place your stop.
If you are buying on the 1-hour chart, your stop should be below the recent swing low on that timeframe. But you should also check if that level is supported by the daily chart. If the daily chart shows a stronger support level below, you may want to place your stop there instead.
The same applies to take-profit levels. The higher timeframe shows the major resistance or support levels. The lower timeframe shows the precise entry. This alignment is the power of multiple timeframes trading.
Conclusion
Perhaps this is not quite the article you were expecting to read about timeframes. But the purest form of interpreting price action comes from having different market perspectives. How to get that if you are not able to interpret the info on different timeframes?
Because brokers are responsible for the information presented, we must rely on that. However, as pointed out during this article, not every time brokers offer the most reliable information out there.
Historical prices will help you more than you can imagine. For instance, if there is a terminal impulsive move on the yearly charts that is bearish, you will have a bias for the long-term perspective. It doesn’t mean you won’t trade on the long side in the meantime, but you will always keep a bearish attitude towards that currency pair or market.
Multiple timeframes analysis is complex. But it clears the way to proper market interpretation. And, in the end, that is what matters the most.
Disclaimer
This article is for educational and informational purposes only. It does not constitute financial advice, trading recommendations, or an offer to buy or sell any asset. Trading forex, commodities, indices, cryptocurrencies, and futures carries significant risk and may not be suitable for all investors. You can lose more than your initial deposit. Past performance does not guarantee future results. Always read full terms, contract specifications, and risk disclosures before trading. Do your own research. Consult a licensed financial advisor if you need professional investment advice.