


The market outlook for the week ahead starts with three things that ended July together that are not supposed to: Brent up 24%, the dollar index below 100, and the 30-year Treasury yield at a 19-year high. Read that combination correctly and the rest of the week writes itself. This market outlook is shaped by forces that have not coexisted in over a decade.
As we build our market outlook for the first full week of August, the key question is whether the dollar’s breakdown is structural or temporary. The market outlook for the dollar has shifted dramatically, and this week’s data will confirm or deny that shift.
The Week in Five Lines: A Market Outlook Snapshot
The Fed held at 3.50 to 3.75% on a 9-3 vote, with three presidents dissenting for an immediate hike. Warsh talked tough and gave no guidance. The market cut September hike odds, sold the front end, and sold the long end harder.
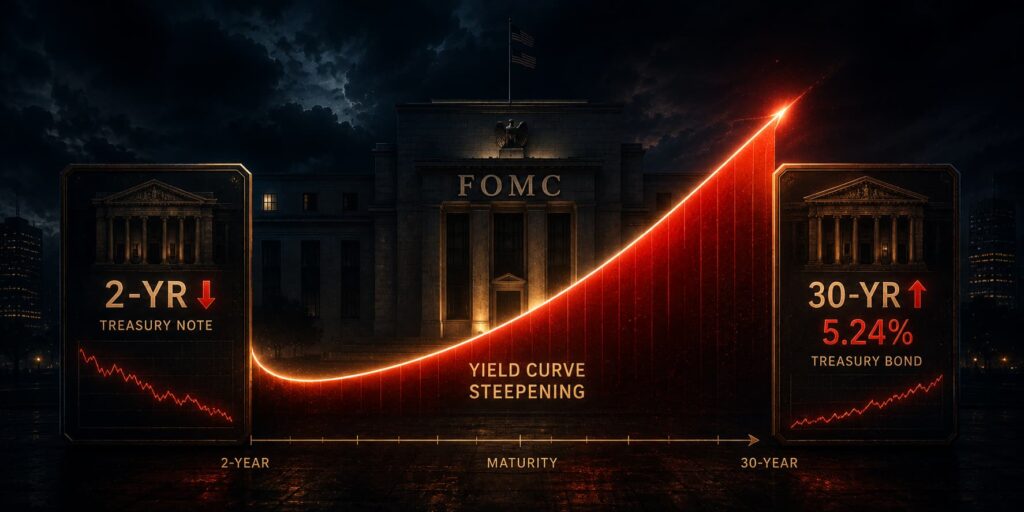
That shape, two-year yields down and the 30-year at 5.24%, is a credibility repricing, not a disinflation repricing. It is the single most dollar-negative configuration in macro and a critical part of our market outlook.
Trump cancelled the Iran strike on Saturday night. Iran denies the account and calls it psychological warfare. There is a pause, not a deal. This market outlook factors in both scenarios.
Japan and the US Treasury jointly bought yen on 31 July. Washington actively participated in selling dollars. That is not a footnote in this market outlook.
Friday is the whole week: US payrolls and Canadian jobs land in the same minute, into a Fed that has deliberately stopped guiding. This is the most important data point in this week’s market outlook.
According to CME FedWatch , September hike odds fell sharply after the FOMC meeting, with markets now pricing only a 32% chance of a hike by the September meeting. This shifts the market outlook significantly.
The Dollar Did Not Fall Because Inflation Faded: A Key Market Outlook Theme
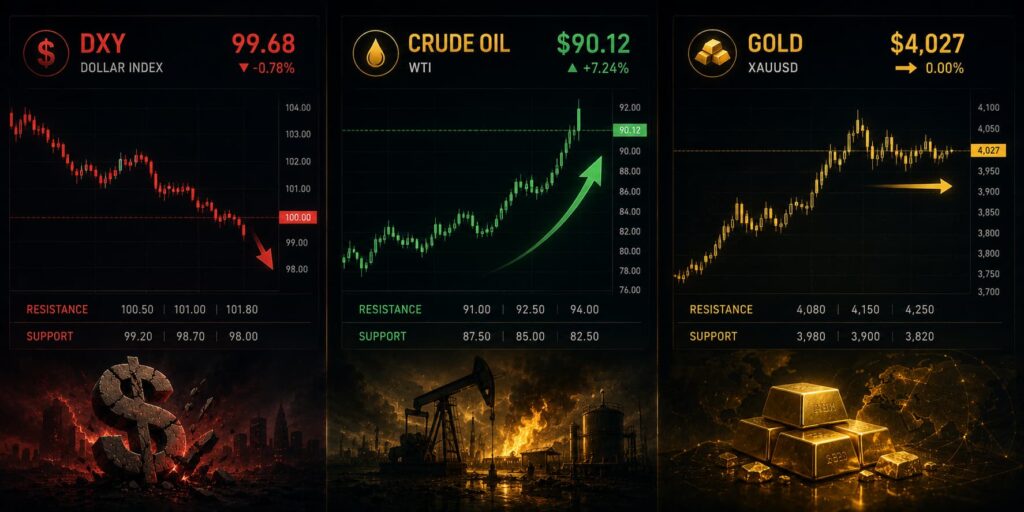
Start with the thing that should not have happened. In a month where Brent crude rose 24% and WTI rose 21%, the dollar index fell about 1.5% and closed July at 99.91, under the round number. An inflation shock plus a central bank that insists it is serious about inflation is normally a currency that goes up. This one went down.
The explanation is in the shape of the curve, not the level of it. This is the central puzzle of our market outlook for the dollar.
At the 29 July FOMC, the Committee held the federal funds target at 3.50% to 3.75% on a 9-3 vote. The three dissenters were Beth Hammack of Cleveland, Neel Kashkari of Minneapolis and Lorie Logan of Dallas, and all three wanted an immediate quarter-point hike. Three dissents pointing the same way is the first time that has happened since September 2016.
Chair Kevin Warsh then went to the podium and said, more or less, that he takes inflation extremely seriously. His line was “there is no soft inflation target.” He also declined to give forward guidance on where rates go for the rest of the year.
The market took about ninety minutes to price what that combination actually means. Two-year yields fell, because a Fed that will not commit is a Fed that probably will not hike in September. And the 30-year rose to roughly 5.21%, then 5.24% the following morning, the highest since 2007. Front end down, long end up. That was one of the largest post-FOMC steepenings since at least the mid-1990s.
Two more things stacked on top of it in the same week.
Growth cracked. Q2 GDP came in at 1.5% against a 2.1% consensus, decelerating from 2.1% in Q1. So the growth side is softening while oil pushes the headline up. That is the stagflation mix, and it is the one environment in which a central bank genuinely cannot win. Warsh has to choose which mandate to break. He declined to say which. This stagflation risk dominates the market outlook.
And Washington helped sell the dollar. After USD/JPY reached about 164, a multi-decade low for the yen, Japanese authorities intervened on Thursday 30 July, and the pair dropped roughly 3% in under an hour. They came back on Friday 31 July. On that second day the Federal Reserve Bank of New York sold euros to buy yen on behalf of the US Treasury. That makes it a coordinated operation with active American participation, not a unilateral Japanese one. USD/JPY closed July at 157.58.
The joint intervention is being under-read. When the US Treasury puts its own balance sheet behind selling dollars, it is telling you the strong dollar is now politically inconvenient in Washington as well as Tokyo. That does not create a downtrend on its own. What it does is remove a floor. Anyone who was short EUR/USD or long USD/JPY on carry now has an official-sector counterparty with unlimited size and no profit motive. You do not fight that; you position around it. This is a structural shift in the market outlook.
What Actually Happened Between the US and Iran: A Market Outlook Wildcard
The sequence matters, because the headline and the substance are different. The market outlook for oil hinges on this distinction.
Friday 31 July. The IRGC said it struck two tankers transiting the Strait of Hormuz under US naval escort. Four more tankers turned back. Brent settled at $90.12 and WTI at $84.67, both up more than 1%, capping the strongest month for crude since March. The US had announced plans to strike Iran as early as that weekend.
Saturday 1 August. Trump cancelled the planned attack. His statement said the US had been asked by Iran and other Middle Eastern countries to hold off “in that the perimeters of a deal has been agreed to.” The terms he described include the immediate reopening of the Strait of Hormuz and an end to Iran’s nuclear threat. Saudi Crown Prince Mohammed bin Salman had called him to raise concerns. Israel agreed to join the commitment. The pause is explicitly conditional on a deal being reached “rapidly.”
Sunday 2 August. Iran rejected the framing. Acting Defence Minister Seyyed Majid Ibn Al-Reza said the statements were “part of a psychological and cognitive warfare campaign” while adding that Iran considers every threat real. Iranian military officials denied Tehran had asked the US to hold off at all, calling that claim “nothing but a new lie,” and said the armed forces are on high alert. Reporting the same day indicated no actual breakthrough on the Strait of Hormuz. The State Department has warned US citizens across the Middle East.
Fact, stated plainly: There is a pause in strikes. There is no verified agreement, no confirmed Hormuz reopening, and one of the two parties publicly denies the other’s account of what was agreed. The market outlook for oil remains uncertain.
For more on [how geopolitical risk moves oil], our framework for reading war premiums through the energy channel.
Our View on Oil and the Gulf: A Market Outlook Assessment
The risk into Sunday’s open is a gap lower in crude on the headline, followed by a market that has to work out it bought a press release. We would be very careful about treating Monday’s first hour of oil as information. Almost all of July’s 24% is a Hormuz risk premium, and that premium unwinds on verified transit, not on a Truth Social post. Watch tanker traffic and insurance rates, not the wire. This is the most immediate risk in our market outlook.
The honest position is that this is genuinely two-sided and we are not going to pretend otherwise to sound clever. What we will say is that the asymmetry has changed. A week ago, oil’s tail risk was violently to the upside. Today there is a real, credible path to $75 Brent that did not exist on Friday morning, and the market is not positioned for it. This asymmetry shapes our market outlook for energy.
According to Reuters – Oil & Markets , the crude rally has been driven almost entirely by the geopolitical risk premium, with fundamental demand data showing no corresponding increase in global consumption. This supports our market outlook.
What Is Actually on This Week: Market Outlook Calendar
All times UK (BST). Higher impact · Medium · Lower. This calendar is the backbone of this week’s market outlook.
| Day | Event | Time | Prior | Why It Matters |
|---|---|---|---|---|
| Mon 3 | US ISM Manufacturing PMI (July) | 15:00 | 53.3 | Watch the Prices Index, not the headline. It was 73.0 in June, down 9.1pts from 82.1 in May, the steepest one-month fall since July 2022. June’s report explicitly listed crude oil among materials falling in price. Then Brent rose 24%. This is the first hard read on whether that reversed. Key for the market outlook. |
| Mon 3 | China Caixin Manufacturing PMI | 02:45 | — | Global demand read for AUD and NZD |
| Tue 4 | NZ Q2 Employment Change | 23:45 | +0.2% q/q | The RBNZ hiked to 2.50% on 8 July, its first rise in over three years, then Q2 CPI printed 4.1%. This is the last major labour input before the 2 September Monetary Policy Statement. |
| Tue 4 | NZ Q2 Unemployment Rate | 23:45 | 5.3% | See above. The hike case is weaker than it looks. |
| Wed 5 | US ADP Employment (July) | 13:15 | +98k | A poor guide to payrolls, but a useful one for positioning going into Friday. Treat it as a sentiment event. |
| Wed 5 | US ISM Services PMI (July) | 15:00 | 54.0 | Services is where US inflation stickiness actually lives. If manufacturing prices spike on oil but services prices stay contained, the Fed’s passivity gets easier to defend. If both go, September is back on. |
| Thu 6 | RBNZ Inflation Expectations (Q3) | 04:00 | 2.53% | Two days after the jobs print and directly relevant to 2 September. If expectations stay anchored near 2.5% despite a 4.1% headline, it confirms the market is pricing an energy spike rather than an inflation problem. |
| Thu 6 | US Initial Jobless Claims | 13:30 | — | The high-frequency labour check the day before payrolls. Carries more weight than usual given how soft June was. |
| Fri 7 | US Nonfarm Payrolls (July) | 13:30 | +57k | The week. June was +57k against roughly 110k expected, with May revised down to 129k. Revisions matter as much as the headline. The most important data point in this market outlook. |
| Fri 7 | US Unemployment Rate | 13:30 | 4.2% | See above. |
| Fri 7 | US Average Hourly Earnings | 13:30 | +0.3% m/m | See above. |
| Fri 7 | Canada Employment (July) | 13:30 | — | Same minute as US payrolls. CAD gets hit from both sides in that instant: its own labour data, the US number, and an oil price that may be unwinding underneath it. |
Not this week, but shaping everything: US CPI for July prints on 12 August, and it is the first inflation report that fully captures the 24% move in crude. The September FOMC is 15 to 16 September. Friday’s payrolls and that CPI are effectively the entire dataset the Committee gets before it decides. These will define the market outlook for the coming month.
For more on [how to prepare for high-impact data], our process for framing economic releases.
The Three Themes Worth More Than Headlines: Market Outlook Priorities
1. There Are Two Inflation Trades, and Only One of Them Can Fade
Most desks will spend this week talking about “the inflation trade” as though it is one position. It is two, and separating them is the highest-value thing you can do right now. This distinction is critical for our market outlook.
The first is the oil-driven headline trade. It is real, it is recent, and it is almost entirely a Strait of Hormuz premium. If transit is genuinely restored, that unwinds fast, because it was built in four weeks. Brent going from $90 back toward the mid-$70s would drag headline CPI expectations down across every developed market. This is the bullish market outlook scenario for the dollar.
The second is the credibility trade, and it lives at the long end of the US curve. That one is not about oil. It is about a Fed that says there is no soft inflation target and then declines to tell you what it will do. A peace deal in the Gulf does not fix that. Only the Fed can fix that, and it just declined to. This is the bearish market outlook scenario.
Our view: Here is the tell for the week, and it is one number. Does the 30-year come back below 5%? This is the single most important question in this week’s market outlook.
- If oil falls and the long end rallies with it, the credibility problem was overstated and the dollar can actually recover, even as September hike odds keep dropping. That is the counterintuitive outcome most people will get wrong.
- If oil falls and the long end stays above 5.20%, you have your answer: the bond market’s problem was never the oil price. It is Warsh. In that world you sell dollar rallies with both hands and you keep gold, because the market is telling you the anchor is gone. This is the bearish market outlook scenario.
2. New Zealand Has Borrowed Its Inflation from the Oil Market
The consensus story is straightforward. The RBNZ hiked to 2.50% on 8 July. Q2 CPI then came in at 4.1% year on year, up from 3.1%, above the 4.0% consensus and above the RBNZ’s own forecast, the highest since Q4 2023. Quarterly inflation ran +1.5%. Hike bets for 2 September ramped up. NZD got bid.
Now look at where the 4.1% came from. The largest contributor was transport, up 10.6%, and inside that petrol rose 27.5%. The second largest was housing and household utilities, with electricity up 12.0%. Meanwhile the RBNZ’s own sectoral factor model, its preferred core measure, held steady at 2.7%.
So the underlying inflation pulse did not move. The imported energy pulse did. This is a crucial insight for our market outlook on NZD.
Our view: NZD is carrying a hawkish premium built on a petrol price set in the Strait of Hormuz. If the pause holds and crude unwinds, that premium has nothing underneath it, and the RBNZ has an unemployment rate at 5.3% giving it every excuse to stop at 2.50%.
That makes NZD the most asymmetric setup in the majors this week. A soft labour print on Tuesday night, into softening oil, into anchored inflation expectations on Thursday, is three strikes in seventy-two hours. We want to be short NZD against a currency that is not also long the same oil trade, which rules out CAD and NOK. This is a high-conviction trade in our market outlook.
3. Friday, 13:30, Is the Messiest Minute of the Month
US payrolls and Canadian jobs release simultaneously. Both hit USD/CAD. Underneath both sits crude, which is CAD’s other main driver and is currently hostage to a Gulf negotiation. This is the most volatile moment in our market outlook.
Payrolls itself carries more weight than a typical month for a specific reason: Warsh removed forward guidance. When a Fed tells you its reaction function, the data gets filtered through a known framework. When it refuses to, the data becomes the framework. Every print between now and 16 September has to do work that the Chair declined to do.
Watch the revisions as closely as the headline. June was +57k. May was revised down to 129k. A third consecutive soft print with downward revisions confirms the labour market is genuinely rolling over, and that lands on a Committee already fighting about whether to hike into it. This is the defining moment of the week’s market outlook.
The Tape: Where We Actually Closed
Friday 31 July 2026 settlement, cross-checked across price sources. These are reference points for structure, not entry signals. This is the starting point for our market outlook.
| Instrument | Price | Change |
|---|---|---|
| DXY | 99.91 | −1.5% in July · worst month since April |
| EUR/USD | 1.1528 | +1.0% in July · July high 1.1547 |
| GBP/USD | 1.3482 | +0.1% Friday · from 1.3276 at month open |
| USD/JPY | 157.58 | −1.2% Friday · July high 164.00 |
| Gold | 4,027 | −1.8% Friday · +0.5% July, first monthly gain since Feb |
| Brent | 90.12 | +24% in July · strongest since March |
| WTI | 84.67 | +21% in July |
| S&P 500 | 7,489 | −0.1% July · first red July since 2014 |
The Levels That Matter: Market Outlook Technicals
DXY. The July low is 99.69 and that is the level, not 100. The index spent Thursday and Friday probing under the round number and closed at 99.91, so 100 has already been broken and is now overhead resistance rather than support. A weekly close below 99.69 opens the June range. On the upside, 100.89 was Wednesday’s Fed-day close and 101.64 was the July high, which is where a genuine credibility repair would have to get to before we would change the view. These levels define our market outlook for the dollar.
EUR/USD. 1.1547 is the July high and the pair closed unchanged on Friday right beneath it at 1.1528, which is a coiled look. Above 1.1547 there is little structure until higher. Support at 1.1433, Thursday’s low, then 1.1353, the July low.
USD/JPY. This one is different because it has an official-sector participant. 164.00 is now the intervention line, and Tokyo has drawn it with Washington co-signing. Friday’s low was 157.58 and it closed there, on the low. Rallies into the low 160s are where the MOF gets interested again.
Brent. $90.12 is the pivot. Almost the entire 24% July move is risk premium, which means the downside is faster than the upside if transit is verified. A break of $85 says the market believes the pause. Back through the July highs says it does not. This is the most important commodity level in our market outlook.
Gold. $4,100 is the near-term pivot it failed at on Friday. Worth keeping in perspective: gold is still more than 25% below its $5,597 all-time high from 29 January 2026, and July was its first positive month since February. It is a credibility hedge here, which is exactly the trade the long end is describing.
The Playbook: Risks Both Ways for the Dollar – Market Outlook Scenarios
Dollar Upside Risks
- The Hormuz deal is real. Crude unwinds, headline inflation expectations fall globally, the long end rallies, the curve re-flattens and the credibility discount comes out of the dollar. This is dollar-positive even though it cuts hike odds further, and it is the outcome most people will misread. This would shift our market outlook bullish.
- ISM Prices spikes Monday. Above 80 hands the three dissenters their argument and puts 15-16 September back in play with a Chair who cannot keep refusing to guide.
- Payrolls beats with hot earnings. A print near or above 130k with average hourly earnings above +0.3% forces the front end to reprice a September hike.
- Positioning. The dollar just had its worst month since April into a broken round number. Short-dollar is now a crowded, consensus expression.
Dollar Downside Risks
- The 30-year stays above 5.20% while oil falls. The cleanest bearish signal available. It isolates the credibility problem from the energy problem and confirms the dollar is the thing being sold. This is the bearish market outlook scenario.
- Payrolls misses badly with downward revisions. Soft growth plus 4%-ish headline inflation is the stagflation vice, and Warsh has already shown he will not act into it.
- Further joint intervention. The US Treasury is now an active seller of dollars against yen. Any repeat compounds it and caps rallies mechanically.
- Iran talks collapse without oil falling. The worst of both: the inflation shock persists, the Fed still does not respond, and the long end goes again. This is the scenario where the dollar falls and gold runs.
Where We Actually Sit: Our Market Outlook Conclusion
Bearish dollar structurally, but not aggressively short into a broken 100 with the whole market leaning the same way and a genuine peace headline in play. We want to sell rallies into 100.89 rather than chase 99.69. The cleaner expressions this week are relative: short NZD on borrowed inflation, and long gold as the credibility hedge, because gold pays off in both the “Fed will not act” scenario and the “talks collapse” scenario. That is the only instrument on the board with that property right now. This is our final market outlook for the week ahead.
Disclaimer
This article is for educational and informational purposes only. It does not constitute financial advice, trading recommendations, or an offer to buy or sell any asset. Trading forex, commodities, indices, cryptocurrencies, and futures carries significant risk and may not be suitable for all investors. You can lose more than your initial deposit. Past performance does not guarantee future results. Always read full terms, contract specifications, and risk disclosures before trading. Do your own research. Consult a licensed financial advisor if you need professional investment advice.