


This week market outlook could get messy. And very fast.
Iran is pushing to leave the NPT and test a nuclear weapon. Two critical oil routes are now under pressure. Crude is back above $100, diesel has broken $6, and the cost of moving oil has gone vertical. Then comes the Fed. A meeting once expected to bring another cut now carries a near 80% chance of a hike, with trillions of dollars of debt waiting to be refinanced. And through all of it, the S&P is still just 2.5% from record highs.
Oil, war, inflation, rates and stocks are all pulling in different directions right now. This market outlook breaks down exactly what is happening and what to watch. This market outlook considers next week one of the most consequential of the year.
The market has moved from worrying about geopolitical risk to dealing with its consequences. Oil above $100, record diesel prices and soaring freight costs are feeding directly into an inflation problem the Fed was already struggling with. Yet equities remain just 2.5% from record highs. That leaves markets caught between two very different forces: a bond market demanding tighter conditions and an equity market still supported by exceptional earnings.
For more on how geopolitical risk moves oil, see our guide on how geopolitical risk moves oil.
Key Takeaways from This Market Outlook
- Oil above $100 and diesel above $6 – The energy shock is now a physical supply disruption, not just a headline. This market outlook considers energy the most important variable.
- East-West pipeline offline and Houthis controlling Bab el-Mandeb – Two critical oil routes are under pressure simultaneously. This market outlook tracks the chokepoint crisis.
- Fed hike odds at ~79% for September 16th – A meeting once expected to bring cuts now carries a near-certain hike. This market outlook tracks the repricing.
- S&P 500 just 2.5% from record highs – Earnings growth of 32% is providing the floor. This market outlook examines the divergence.
- VLCC freight at $800,000 per day – An all-time high, showing the cost of moving oil has gone vertical. This market outlook considers freight the key signal.
- Iran pushing to leave the NPT and test a nuclear weapon – A new variable for geopolitical and oil volatility. This market outlook flags this as a wildcard.
- Equities now 48.2% of household financial assets – A record, exceeding the dot-com peak of 38.7%. This market outlook considers this a critical vulnerability.
The Charts That Matter – A Market Outlook Perspective
This market is proving incredibly difficult to scare. Even with oil above $100, yields pushing higher and another Fed hike suddenly back on the table, equities remain remarkably close to record highs. Strong earnings are giving investors a reason to keep looking through the noise, but that resilience now faces a much tougher test. This market outlook examines the resilience.
If higher energy costs keep feeding inflation and rates, the question becomes how long earnings can keep overpowering everything else. This market outlook considers this the key question for the week ahead.
S&P 500: The Resilience That Defies Logic
The S&P 500 is sitting just 2.5% from record highs. That looks strange beside a 10-year yield that just touched 4.99% and a market pricing a 79% probability of another rate hike. But equities have something the bond market doesn’t: earnings.
Full-year S&P 500 profit growth is now projected at 32% for 2026, up from 24% before the Q2 earnings season. Around 86% of S&P 500 companies beat expectations this quarter, the strongest beat rate since 2021. Energy earnings are projected to grow 83%, while Information Technology sits at 59%. This market outlook considers earnings the floor for equities.
The equity market isn’t ignoring higher rates. It simply has another force pushing in the opposite direction. Companies are delivering enough earnings growth to keep investors committed even while the rate environment becomes increasingly uncomfortable. This market outlook tracks this tension.
And households are more exposed to that strength than ever. Equities now account for a record 48.2% of U.S. household financial assets. For context, the dot-com peak was 38.7%. Since the 2022 bear market, the share has risen 13.9 percentage points. This market outlook considers this a critical vulnerability.
That creates a very unusual divide. Asset owners continue benefiting from equity strength while anyone depending heavily on borrowing is dealing with a very different economy. The bond market is showing the cost of money, whereas the stock market is showing the strength of corporate profits. Both can be true at the same time. This market outlook examines both.
Nasdaq: The Yield-Sensitive Test
Growth stocks tend to feel rising yields more directly because higher rates reduce the value investors place on future earnings. Yet the strength of corporate results has helped offset a bond market that would normally be far less friendly to this part of the market. This market outlook considers the Nasdaq the key test for rate sensitivity.
The bigger test isn’t another headline. It’s whether earnings strength can keep absorbing a higher cost of money. This market outlook flags this as the key question for the Nasdaq.
DXY: The Tug-of-War
The dollar now sits right in the middle of the contradiction. A Fed potentially moving towards another hike would normally strengthen the case for the dollar as U.S. yields become more attractive. But the same higher rates are colliding with an enormous refinancing burden and rapidly rising government interest costs. This market outlook considers the dollar a key confidence gauge.
That tug-of-war makes the dollar useful here, because it can show whether traders are more focused on tighter Fed policy or the longer-term cost of maintaining it. This upcoming week could be pivotal. This market outlook tracks the dollar’s resolution.
For more on how the dollar moves gold, see our guide on how the dollar moves gold.
The Oil Problem Just Got Much Bigger – A Market Outlook Deep Dive
Saudi Arabia’s East-West pipeline was supposed to be the escape route. Now it’s offline too. The pipeline can carry up to roughly 7 million barrels per day and is Saudi Arabia’s only crude export route that avoids the Strait of Hormuz. Following attacks across multiple locations, the kingdom announced a full shutdown. This market outlook considers this a critical development.
At the same time, the Houthis have taken control of key territory along the Yemeni side of Bab el-Mandeb, including Perim Island. Hormuz itself remains under attack, with Iran launching multiple waves of anti-ship missiles and drones towards a large U.S.-escorted tanker convoy. This market outlook tracks the chokepoint crisis.
This isn’t one chokepoint anymore. The pressure is spreading across the routes the market would normally rely on when another becomes dangerous. This market outlook considers this a systemic supply risk.

The Freight Signal
The clearest evidence isn’t coming from another military statement. It’s coming from freight. VLCC earnings on Middle East to China routes have reached nearly $800,000 per day, an all-time high, after more than doubling in two months. A U.S. Gulf to Asia VLCC charter has also reached roughly $29.5 million per voyage before war-risk and delay fees. This market outlook considers freight the key signal.
That tells us something important. Even where oil can physically move, getting it from one place to another has become dramatically more expensive. Fewer ships are willing to move through Hormuz, alternative routes keep tankers occupied for longer, and that removes available capacity from the market. This market outlook tracks this cost transmission.
And the cost is already travelling further down the chain. U.S. diesel has moved above $6 a gallon for the first time, up 74% over nine months, with some states pushing above $8. This is where an energy shock stops being something traders only see on a crude chart. Transport gets more expensive. Moving goods gets more expensive. Inflation expectations rise. This market outlook considers diesel the most important commodity price.
China’s Offset
China provides one important offset. Its crude imports increased for a second consecutive month in August, but estimated inventories above 1.2 billion barrels give it room to reduce purchases if prices continue surging. So China doesn’t necessarily need to chase oil higher. That may soften demand at the margin, and it doesn’t put more tankers back in the water. This market outlook considers China’s inventory a key variable.
The Nuclear Risk
Then comes the nuclear risk. Iran is preparing a triple-urgency bill to withdraw from the NPT and test a nuclear weapon, with lawmakers arguing the country now needs a nuclear deterrent. That becomes particularly uncomfortable beside Trump’s own comment that if Iran already possessed a nuclear weapon, he would be calling the Supreme Leader rather than bombing him. This market outlook flags this as a wildcard.
Markets now have to consider two very different paths. Escalation towards a nuclear test could push the geopolitical premium significantly higher. But the prospect of a nuclear deterrent changing Washington’s behaviour could also completely alter how the conflict is priced. Either way, it adds another source of volatility to an oil market that hardly needed one. This market outlook tracks both scenarios.
What Happens Next with Oil
If the East-West pipeline remains offline while Hormuz stays dangerous, freight pressure is likely to remain elevated because alternative export capacity has disappeared. If Houthi control around Bab el-Mandeb begins materially restricting shipping, another major route becomes harder and more expensive to use. If Iran’s nuclear legislation progresses, oil could become even more sensitive to political and military headlines. If China leans more heavily on its existing inventories, some crude demand pressure could ease without solving the freight problem. This market outlook tracks all four scenarios.
How Markets May Respond to the Oil Crisis
Crude is now carrying more than a traditional geopolitical risk premium and the market is pricing the physical difficulty and cost of moving energy. That makes freight, diesel and oil volatility particularly important. If those remain elevated even when military headlines temporarily calm, it would suggest the market sees the disruption as something more persistent. If they begin falling together, that would tell us confidence in physical supply is returning. This market outlook considers freight the key signal to watch.
The Fed Just Got Trapped – A Market Outlook Analysis
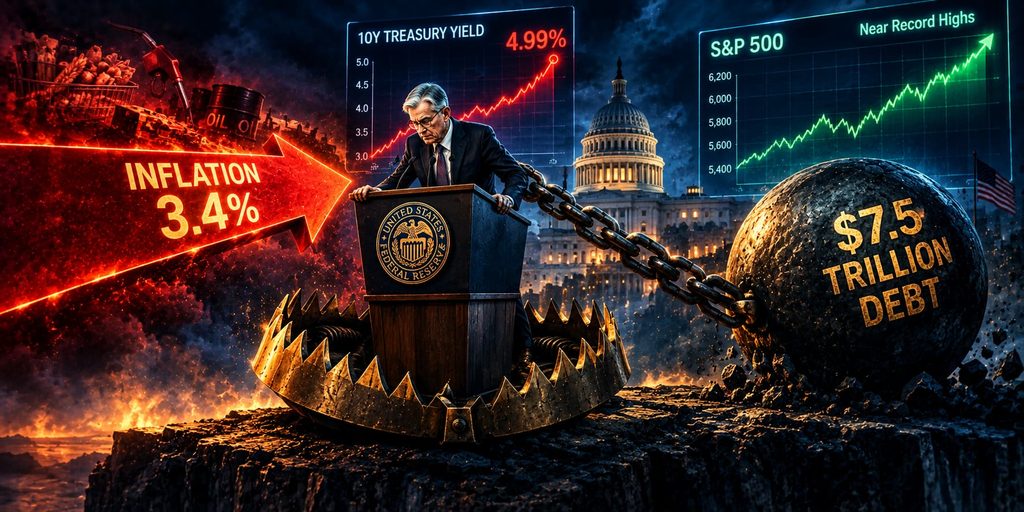
The timing could hardly be worse. August CPI came in at 3.4%, with core CPI at 2.4%, both in line with expectations. But monthly CPI increased 0.4%, the largest rise since May. Markets reacted immediately. The probability of a September rate hike surged to a huge possibility, despite the same meeting being priced as the third rate cut of 2026 at the beginning of the year. This market outlook tracks the repricing.
According to CME FedWatch, the probability of a September hike has surged to nearly 80% following the August CPI release.
Stocks and gold were hit at the release, then fully recovered within 20 minutes. The 10-year Treasury yield jumped to 4.99% before finishing lower on the day. That isn’t a market with a settled view. It’s a nervous one. This market outlook considers the violent reversal a key signal.
Why the Fed Is Trapped
The Fed doesn’t walk into September 16th with CPI alone. PPI is running at 5.4%. August payrolls added 162,000 jobs, above expectations. Oil is above $100. Diesel is at record levels. And inflation remains at least 140 basis points above the Fed’s 2% target. These are all critical points heading into next week with more decisions to come. This market outlook considers the Fed trapped.
The energy shock is making the inflation problem harder at exactly the point markets had expected monetary policy to be moving in the opposite direction. But raising rates comes with another problem. The U.S. has roughly $7.5 trillion of marketable Treasury debt maturing in 2026, while around $6.1 trillion of approximately $7 trillion in outstanding T-bills matures within a year. This market outlook tracks the refinancing burden.
A 75 basis point increase would add roughly $50 billion per year to T-bill interest costs as debt rolls onto higher coupons. And the starting position is already uncomfortable. Net interest, Social Security, Medicare, healthcare and veterans spending now consume 98.4% of federal receipts. Net interest alone takes a record 19.7%. This market outlook considers this the fiscal trap.
So higher rates may help address inflation pressure, but they also make refinancing the government’s enormous debt stock more expensive. That’s the trap markets are trying to price. This market outlook considers this the central tension.
The Political Complication
There is a political complication too. Trump made rate cuts a precondition when selecting his Fed Chair. Now that Chair potentially enters his first major decision with markets pricing a hike. The Fed isn’t giving guidance. September 16th therefore becomes the point where all these contradictions finally meet. This market outlook flags this as a key risk.
What Happens Next with the Fed
If energy and diesel prices remain elevated into the meeting, markets may continue treating inflation as a problem the Fed cannot easily look through. If the Fed raises rates, attention could quickly shift from inflation towards the cost of refinancing trillions of dollars of government debt. If rates are left unchanged despite elevated inflation pressure, the reaction may depend heavily on how markets interpret the Fed’s willingness to tolerate that pressure. With no guidance beforehand, Treasury yields and the dollar may remain highly sensitive to any change in expectations. This market outlook tracks all three scenarios.
How Markets May Respond to the Fed
Rates are becoming the transmission mechanism between the energy shock and everything else. Higher oil and diesel keep inflation pressure alive. That pushes rate expectations higher. Higher rates then increase government financing costs and put more pressure on assets sensitive to yields. Gold’s violent CPI reversal showed how uncertain that relationship has become. The first reaction was aggressive. Twenty minutes later, the market had already changed its mind. This market outlook considers the violent reversal a key signal.
For more on how to prepare for high-impact data, see our guide on how to prepare for high-impact data.
Asset Owners Are Still Winning – A Market Outlook Perspective
And somehow, through all of this, the S&P 500 is only 2.5% from a record high. That looks strange beside a 10-year yield that just touched 4.99% and a market pricing a 79% probability of another rate hike. But equities have something the bond market doesn’t: earnings.
Full-year S&P 500 profit growth is now projected at 32% for 2026, up from 24% before the Q2 earnings season. Around 86% of S&P 500 companies beat expectations this quarter, the strongest beat rate since 2021. Energy earnings are projected to grow 83%, while Information Technology sits at 59%. This market outlook considers earnings the floor.
Why This Matters
The equity market isn’t ignoring higher rates. It simply has another force pushing in the opposite direction. Companies are delivering enough earnings growth to keep investors committed even while the rate environment becomes increasingly uncomfortable. This market outlook tracks this tension.
And households are more exposed to that strength than ever. Equities now account for a record 48.2% of U.S. household financial assets. For context, the dot-com peak was 38.7%. Since the 2022 bear market, the share has risen 13.9 percentage points. This market outlook considers this a critical vulnerability.
That creates a very unusual divide. Asset owners continue benefiting from equity strength while anyone depending heavily on borrowing is dealing with a very different economy. The bond market is showing the cost of money, whereas the stock market is showing the strength of corporate profits. Both can be true at the same time. This market outlook examines both.
That’s why the S&P has been so difficult to knock down because earnings are providing the floor. And funnily enough, the oil shock and rates are providing the ceiling. This market outlook considers this the key dynamic.
What Happens Next with Equities
If earnings revisions remain strong, equities have a fundamental reason to keep resisting pressure from higher yields. If rates continue climbing, valuations face a harder test even if corporate profits remain healthy. If energy earnings keep improving alongside elevated oil prices, part of the geopolitical shock may continue appearing as stronger profits inside the index. If earnings weaken while yields remain high, the support keeping equities close to their highs becomes much less convincing. This market outlook tracks all four scenarios.
How Markets May Respond to Earnings
The S&P can remain resilient while the bond market stays under pressure, but the gap between the two becomes increasingly important. Strong earnings help explain why higher yields haven’t produced a larger equity drawdown. But the closer household exposure gets to historic extremes, the more market wealth depends on those earnings continuing to deliver. For now, asset owners are still winning. The bond market is simply making that victory increasingly expensive. This market outlook considers this the key tension.
Cross-Asset Implications – A Market Outlook Summary
Energy
Physical disruption is showing up in crude, freight and diesel rather than remaining a geopolitical headline. This market outlook considers energy the most important variable.
Rates and USD
Inflation pressure has brought a September hike firmly back into the conversation, with Treasury refinancing making every move in rates more consequential. This market outlook tracks the rate transmission.
Equities
Exceptional earnings continue supporting the S&P even as bond yields and energy costs move against it. This market outlook considers earnings the floor for equities.
Key Conditions to Watch – Market Outlook Checklist
- Whether VLCC freight remains extreme even if crude prices temporarily settle. This market outlook considers freight the key signal.
- Whether diesel continues rising, showing that the energy shock is reaching the wider economy. This market outlook tracks diesel as the transmission channel.
- Whether September hike expectations hold near current levels going into the Fed meeting. This market outlook considers the Fed decision the main event.
- Whether earnings strength continues giving the S&P enough support to absorb higher rates. This market outlook considers earnings the floor.
- Whether the East-West pipeline is restored. This market outlook considers any restoration a key de-escalation signal.
- Whether Iran’s nuclear legislation progresses. This market outlook flags this as a wildcard.
- Whether the Trump-Xi summit proceeds. This market outlook tracks the geopolitical overlay.
Events That Matter
September 16th Fed meeting: The market is pricing a 79% chance of a hike after August CPI. This market outlook considers this the main event.
Iran’s NPT and nuclear-test bill: A major new variable for geopolitical and oil volatility. This market outlook flags this as a wildcard.
East-West pipeline developments: Any restoration would return an important route around Hormuz. This market outlook tracks any updates.
Trump-Xi summit: China has threatened to cancel the September 24 meeting over new Taiwan arms sales, complicating U.S. attempts to pressure Beijing over its relationship with Iran. This market outlook considers this a geopolitical overlay.
Where This Leaves Markets – The Market Outlook Conclusion
A lot happened this week, with even more expected next week. The energy shock is no longer just about oil. Freight and diesel show that the cost is travelling through the economy, and that puts inflation straight back in front of the Fed. The Fed then has to weigh that pressure against a debt market facing an enormous refinancing year. And somehow equities are still sitting near record highs because corporate earnings continue giving investors a reason to stay. This market outlook has tracked all of these forces.
That’s the tension now. Oil is testing inflation. Inflation is testing rates. Rates are testing equities. So far, earnings have stopped that chain from breaking the stock market. September 16th may tell us how much harder that becomes.
The bottom line from this market outlook:
The market is balancing two realities at the same time. Expensive energy, stubborn inflation and geopolitical risk are real and persistent. But strong earnings and AI adoption are also real. The resolution will come from which force wins the battle for capital.
Next week is vital and volatility is likely to be high. Be cautious where possible and take these things into consideration.
This market outlook has prepared you for all the key scenarios. Now it’s up to you to execute.
Disclaimer
This article is for educational and informational purposes only. It does not constitute financial advice, trading recommendations, or an offer to buy or sell any asset. Trading forex, commodities, indices, cryptocurrencies, and futures carries significant risk and may not be suitable for all investors. You can lose more than your initial deposit. Past performance does not guarantee future results. Always read full terms, contract specifications, and risk disclosures before trading. Do your own research. Consult a licensed financial advisor if you need professional investment advice.