


The US Dollar Index is trading around the 101.5 area, just under the 101.80 ceiling it has been unable to close above, after tagging its strongest level in more than a year. Core PCE on 25 June took a little air out of the move, and the dollar eased without breaking its rising support, so the trend is intact.
This dollar outlook covers why the dollar is bid, the levels that matter, and the data that decides July. The next decisions are not guesses, they are prints: June payrolls on 2 July, June CPI on 14 July, and the Federal Reserve on 29 July.
What changed since the last update: PCE printed and the dollar pulled back modestly from 101.80 while holding its higher lows, so the read shifts from “into PCE” to “into payrolls and the FOMC.” This dollar outlook treats the dollar as the master key for all other assets.
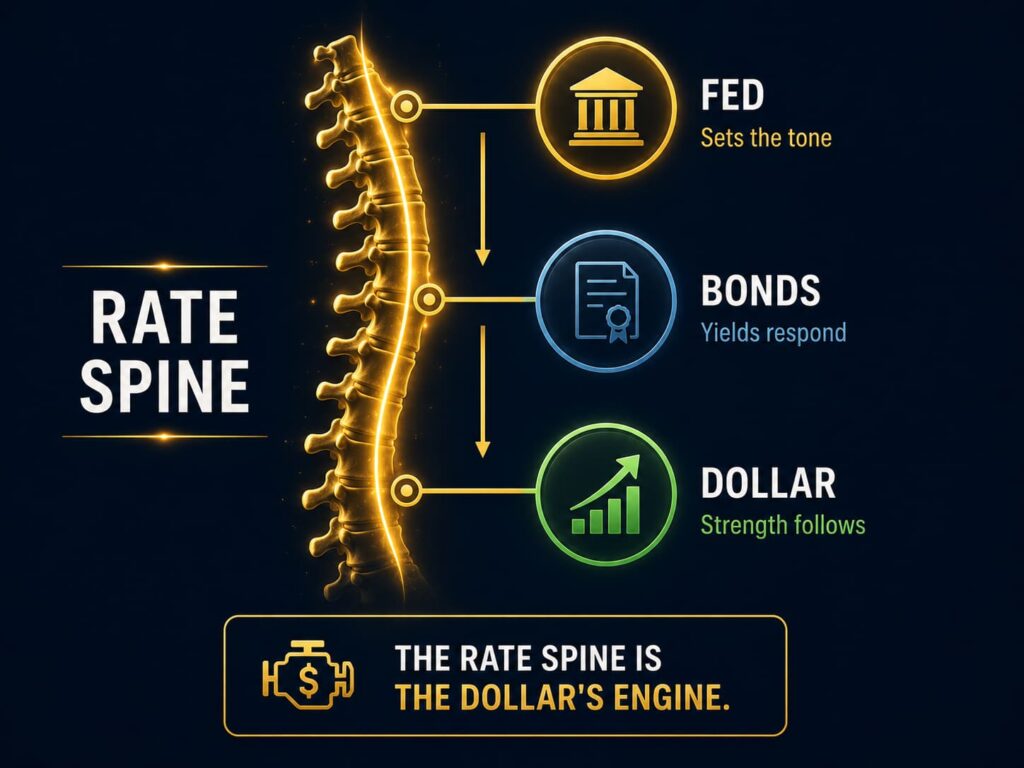
For a deeper look at [how the Fed shapes the dollar], this dollar outlook recommends understanding the rate spine that drives the greenback.
Where the Dollar Is Right Now
The US Dollar Index, DXY, sits around 101.5, having printed its strongest level in over a year before easing from the 101.80 area on the 25 June core PCE read. This is not a one-day spike on a scary headline. It is the fourth higher leg in a row, a trend, and trends like this have an engine underneath them. The engine is rates.
When you understand why the dollar is bid you stop guessing at the chart and start trading the cause, and the cause here is unusually clean. This dollar outlook starts with that cause.
Two ways a dollar rallies, and why this one is the durable kind. There are only two reasons the dollar rises, and they are not equal. The first is fear, a panic bid where capital runs to the world’s reserve currency in a crisis. The second is yield, where the dollar simply pays you more to hold it than the alternatives.
A fear bid is violent and short. It drains out the moment the headline fades. A yield bid is slower and far more stubborn. It lasts until the rate story itself changes. What is driving the dollar now is the second kind. That is the single most important thing to understand about this dollar outlook, because it tells you the pullbacks are pauses, not reversals, until the rate story turns.
The dollar outlook is shaped by how the Fed communicates its policy path. Warsh has been clear: inflation is the priority, and rate cuts are not coming soon. That language has anchored the front end of the curve and supported the dollar.
If the Fed’s communication shifts dovish, the dollar outlook would change. A hint of easing would compress rate differentials and pressure the dollar. But for now, the Fed’s hawkish stance is a pillar of the bullish dollar outlook.
The market is watching every word from Fed speakers. Any softening of the hawkish language would be a signal to reassess the dollar outlook. For now, the communication regime supports the bid.
For a deeper look at [interest rates and forex], this dollar outlook covers how yields drive the greenback.
The Mechanism Most Traders Miss: The Dollar Is a Real-Yield Trade
Here is the part that separates a desk read from chart-watching. The dollar does not really care about the level of inflation on its own, and it does not care about any single news headline for longer than a session. It cares about the expected path of US real yields, the return you earn after inflation, measured against the rest of the world.
When the market believes the Fed will hold firm or hike while other central banks sit still or cut, US real yields rise relative to everyone else, and global capital rotates into dollars to capture the difference. That is the channel every dollar move runs through.
If you want to see it before it reaches the DXY chart, watch three things. The two-year Treasury yield, which is the cleanest proxy for where the market thinks the policy rate is going. The ten-year inflation-protected yield, the real yield itself. And the gap between US yields and German or Japanese yields, because the dollar is a relative trade, never an absolute one.
When those move, the dollar is already moving underneath the price. Most retail traders react to the dollar candle. The desk reads the rate market that prints it. This dollar outlook is built on that read.
For the official source, the Federal Reserve publishes the monetary policy framework that shapes real yields.
Why the Euro Is the Dollar’s Shadow
One technical point that pays for itself. The Dollar Index is not evenly spread across the world. It is dominated by the euro, which carries roughly 57.6 per cent of the weight, with the yen near 13.6 per cent and the pound near 11.9 per cent making up most of the rest.
In practice that means DXY is, to a first approximation, an inverse euro chart. So when you read “the dollar is strong,” what the index is really telling you most of the time is that the euro is weak against it, which is why EUR/USD has been pinned near 1.14, its lowest in about a year.
If you trade the dollar, you are trading the European Central Bank against the Federal Reserve whether you realise it or not. That is why the desk always checks the rate gap, not just the DXY line. This dollar outlook treats the euro as the dollar’s shadow.
The Engine: A Flipped Fed and a One-in-Three July Hike
For nearly two years the only question on the dollar was when the Fed would cut. That question has flipped. After the Fed held its policy rate at 3.50 to 3.75 per cent in June, firmer inflation data put a July hike back on the table, and the market is now pricing better than a one-in-three chance of it.
As of late June, futures implied roughly a 37.6 per cent probability of a hike at the 29 July meeting, against a 62.4 per cent hold. A month earlier that number was a rounding error. The exact figure is not the point, because it moves with every print. The direction is the point. The odds are climbing, not falling, and a rising hike probability is the cleanest reason there is for a bid dollar.
This is a data-dependent Fed in the mould of “we are watching the data,” so the path is not a guess, it is decided at the data. This dollar outlook tracks that path.
For the official source, the CME FedWatch Tool tracks the market-implied hike probabilities.
Why July Is the Month That Decides It
Three prints land before the decision, and each one moves the hike odds, and the dollar with them. This dollar outlook treats each as a potential catalyst.
| Date | Event | Why It Matters for the Dollar |
|---|---|---|
| 25 June (done) | Core PCE | The Fed’s preferred inflation gauge. It printed, and the dollar eased slightly without breaking trend. |
| 2 July | June payrolls (NFP) | A strong labour market keeps the hike alive and supports the dollar. A weak one pulls the odds down. |
| 14 July | June CPI | Sticky inflation is the strongest single case for a hike, and the strongest fuel for the dollar. |
| 29 July | FOMC decision | The decision and, just as important, the guidance on what comes after it. |
Hot prints lift the odds and the dollar. The recent run has leaned hot. That is why this dollar outlook has a constructive bias unless the data turns.
The Levels and Structure That Matter
The macro comes first, but structure tells you whether the move is healthy. The trend on DXY is up, and dips have been bought rather than sold. The index has been pressing the 101.80 area as overhead resistance while holding a rising series of higher lows beneath.
The honest read is that the dollar is stretched after a hard run, so a profit-taking pullback is a normal pause, not a reversal. The thing that would genuinely change the read is a clean break of the rising higher-low support that has defined this trend. Until that gives way, dips are pauses.
Overhead: the 101.80 area, the ceiling the dollar keeps testing.
Where we are: around 101.5, consolidating just beneath that ceiling.
The line that matters: the rising higher-low support. Hold it and the trend is intact. Break it on a soft print and the read changes.
This dollar outlook treats the structure as confirmation of the macro read.
For more on [trading key levels and structure], this dollar outlook covers how to use technicals to time entries.
The Intermarket Map: The Dollar Is the Master Key
The reason the desk leads with the dollar is that it shows up everywhere. The same single move wears different faces across your screen. This dollar outlook maps the intermarket read.
EUR/USD near 1.14, its lowest in about a year, because the euro is the biggest mirror of dollar strength.
GBP/USD grinding toward the 1.30 area, dragged by the same dollar bid plus its own UK politics.
Gold heavy near the 4,000 to 4,050 area, because a firm dollar and firm real yields are the cleanest headwind there is for an asset that pays you nothing to hold.
USD/JPY elevated, because the rate gap between a firm Fed and a slow Bank of Japan keeps the carry working.
You cannot read any of these in isolation. Read the dollar and the rate path first, then take the EUR, GBP, gold or yen setup with the wind behind it instead of against it.
The Carry Trade and the Dollar’s Structural Bid
One of the most persistent drivers of the dollar outlook is the carry trade. It is often misunderstood, yet it is one of the most reliable sources of dollar demand in the current environment.
The carry trade is simple: borrow in a low-yield currency and lend in a high-yield currency. Right now, that means borrowing in yen (near-zero rates) and lending in dollars (where the policy rate is 3.50 to 3.75 per cent and rising hike odds are pushing yields higher). The rate differential is the engine, and the differential has been widening.
This matters for the dollar outlook because the carry trade creates structural demand for the dollar. It is not speculative. It is mechanical. Institutions borrow yen, convert to dollars, and buy US Treasury bills. That flow is persistent and largely unaffected by headline noise.
The dollar outlook would shift if the carry trade unwound. That happens when rate differentials compress. A surprise rate cut from the Fed, a sudden hike from the Bank of Japan, or a global risk-off panic that triggers a yen squeeze could force a carry unwind. That would be a structural headwind for the dollar.
The Geopolitical Anchor: Strait of Hormuz
The US and Iran are trading blows again. Over the weekend, US forces struck Iranian targets after a tanker was hit near the Strait of Hormuz, in what wire services have called the worst escalation since the two sides signed a ceasefire framework earlier in June.
If you trade gold, the dollar, oil or indices, the question is not who is right. The question is what it does to your screen. This dollar outlook treats the Strait as the wildcard that could override the data.
A ceasefire framework exists, and it is fragile. Reporting indicates the US and Iran signed a memorandum of understanding around 17 June 2026 intended to wind down the war and ease the blockade of the Strait. The two sides are inside a roughly 60-day ceasefire window, and each now accuses the other of violating it.
The latest flare-up is real but contained, so far. A tanker was struck by an Iranian one-way attack drone near the Strait on 27 June. US forces responded with strikes on Iranian military targets. Targets are military, not civilian. That is the single most important detail for markets. As of the last check, the exchanges have hit military and maritime infrastructure, not cities or civilian energy facilities. Markets treat those two things completely differently.
The Strait of Hormuz is contested, not closed. Iran has at times declared the waterway shut; the US has rejected that. Traffic is far below normal, but still moving. In short: badly disrupted, heavily watched, but still moving.
This is the transmission chain that defines the dollar outlook right now. When oil prices rise, headline CPI rises. When CPI rises, the Fed stays hawkish. When the Fed stays hawkish, the dollar stays bid.
The recent geopolitical headlines around the Strait of Hormuz have kept oil volatile. But the dollar outlook treats oil as a variable that reinforces the bid, not one that threatens it. As long as oil remains elevated, inflation remains sticky, and the Fed remains hawkish, the dollar has a structural tailwind.
Why does this move your account? Because the Strait of Hormuz carries roughly a fifth of the world’s seaborne oil. The market does not trade the headlines. It trades the barrels.
Why a Middle East Flare-Up Moves Your Portfolio: It Is About Inflation
Here is the chain that every trader needs to hold in their head, because it is the reason this conflict has moved markets all year.
Strait risk threatens oil supply. Hormuz is the single most important oil chokepoint on earth. When passage is threatened, the market prices in less oil.
Higher oil feeds inflation. Energy runs through everything, transport, production, the cost of living. The energy shock from this conflict already pushed US headline CPI to around 4.2% in May.
Stickier inflation keeps central banks hawkish. This is the part that has caught a lot of traders out. The Fed under new Chair Kevin Warsh has turned firmly hawkish, pulling easing language and keeping the focus on inflation. Markets are no longer pricing cuts. They are pricing rate hikes.
That drives the inflation trade. Higher-for-longer (now higher-and-rising) rates lift bond yields and the US dollar, and put pressure on gold.
This is not just a US story. Several central banks have already pivoted from cutting to tightening because of the same global inflation impulse. The era of easy cuts has, for now, paused.
Three Scenarios for the Dollar Outlook
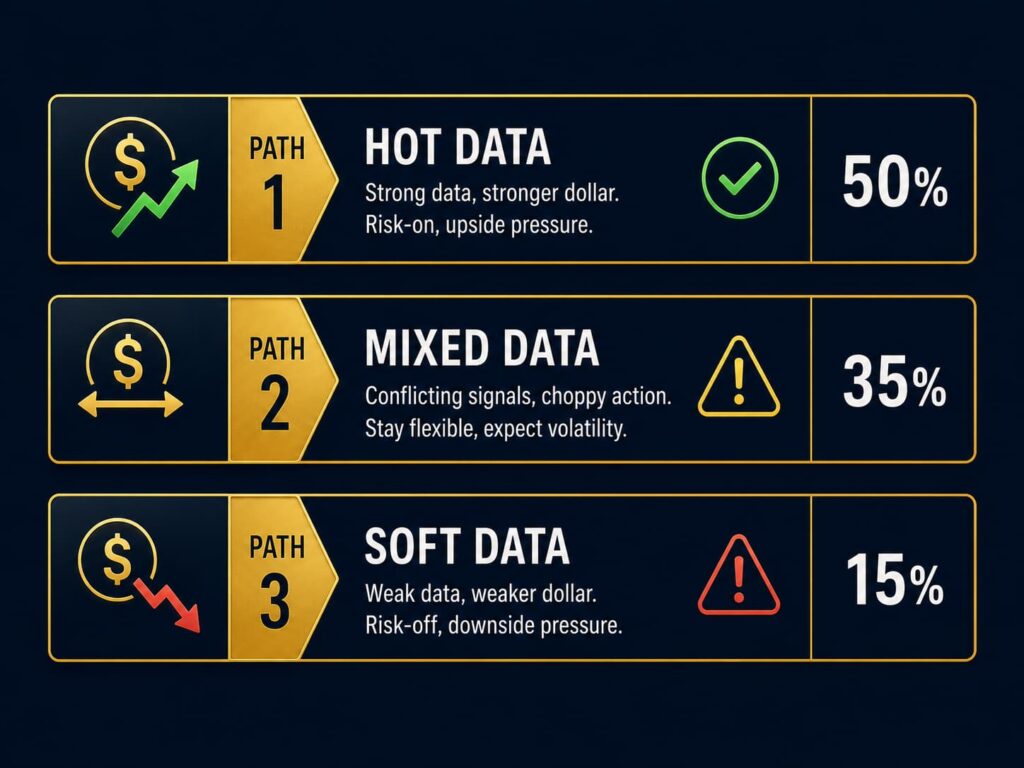
This dollar outlook maps three paths into the 29 July FOMC.
Scenario 1: Hot data, the base case (50%)
PCE firm, jobs strong, CPI sticky. The hike odds push toward 50 to 60 per cent, the dollar extends, and the majors and gold stay under pressure. This is the path the recent data leans toward. The dollar outlook treats this as the base case.
Scenario 2: Mixed data (35%)
Some firm, some soft. The dollar stays bid but choppy, with normal pullbacks that get bought. The trend survives, but the ride is two-sided and you respect both edges.
Scenario 3: Soft data, less likely (15%)
Soft PCE, a weak jobs print, a cooler CPI. The hike comes off, and you get the first real correction in the dollar, which hands the euro and gold a floor. The desk treats this as possible, not the base case right now, but it is the scenario that flips the month, so it is the one to watch hardest.
What Would Flip the Dollar Lower
A good desk always knows what would prove it wrong. For the dollar the bear case is simple: the data cools.
One soft inflation print plus one weak payrolls number would pull the hike bets back out, compress the dollar’s yield advantage, and break that higher-low structure.
A genuine risk-off panic could also spike the dollar short term and then unwind it once the Fed is forced dovish.
And the tail nobody prices until it happens is a policy surprise or intervention from another major central bank that closes the rate gap from the other side.
None of these is the base case today. But if you see the higher lows break on a soft print, you respect it rather than argue with it. This dollar outlook respects both sides.
Final Takeaway
The July outlook for the dollar is bullish as a base case. The driver is the US real-yield path, the engine is the repricing toward a possible Fed hike, and the trigger dates are payrolls, CPI and the 29 July FOMC.
The structure is higher while the rising support holds, with 101.80 the ceiling to clear and the higher-low support the line that defines the trend.
You cannot read the euro, the pound or gold by themselves this month. Read the dollar and real yields first, then take the setup with the wind behind it. And keep one eye on the soft-data scenario, because that is the one that flips the month.
The dollar outlook is clear: the bid holds until the data breaks it.
Disclaimer
This article is for educational and informational purposes only. It does not constitute financial advice, trading recommendations, or an offer to buy or sell any asset. Trading forex, commodities, indices, cryptocurrencies, and futures carries significant risk and may not be suitable for all investors. You can lose more than your initial deposit. Past performance does not guarantee future results. Always read full terms, contract specifications, and risk disclosures before trading. Do your own research. Consult a licensed financial advisor if you need professional investment advice.