


Bond Yields Explained: What Is Happening Right Now
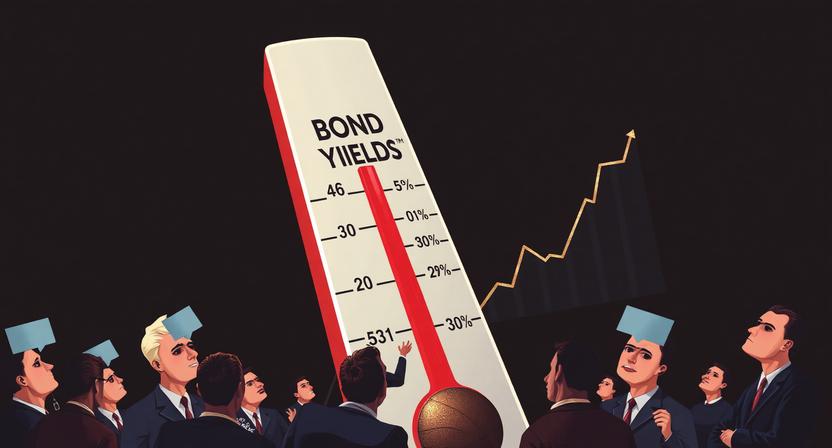
Global bond yields are screaming. The selloff that began last week accelerated dramatically at the start of this week, sending bond yields across developed economies to multi-year highs. This is not a routine repricing. It is a structural signal that institutional investors no longer believe inflation is transitory.
Understanding bond yields is not optional for traders. Bond yields drive the cost of money. They influence the dollar, gold, and every risk asset in between.
This guide explains what bond yields are, why they are rising, and what it means for your trading.
What Is the Bond Market?
The bond market, also known as the debt market or credit market, is where participants issue new debt (primary market) or buy and sell debt securities (secondary market). This is usually in the form of bonds, but may include notes, bills, and other instruments.
The bond market is dominated by the United States, which accounts for about 40% of the global market. As of 2026, the total bond market outstanding was estimated at 143.15 trillion worldwide, with 143.15 trillion worldwide, with 58 trillion in the US market, according to [SIFMA] .
Bonds and bank loans form the credit market, which is about three times the size of the global equity market. Bank loans are not securities under US law, but bonds typically are, making them more regulated. Bonds are sold in relatively small denominations of 1000 to 10000 and can be held by retail investors.
Unlike bank loans, bond yields are publicly traded and watched by millions of traders every day.
Why Bond Markets Are More Stable Than Stocks
You may wonder why stock prices fluctuate much more than bond yields from the same companies.
When companies issue bonds, they are contractually obligated to make interest payments and return the face value at maturity. Defaulting on a bond is serious and typically forces a company into bankruptcy. Even then, bondholders are repaid from company assets if available.
Because the terms of a bond are known in advance, bond yields usually fluctuate in a relatively narrow range compared to stock prices.
For a full breakdown of [understanding market sentiment indicators], our guide explains how bond and stock sentiment differ.
What Can Shake Up Bond Markets?
When investors run scared from stock market volatility, they often move money into bonds. This pushes bond prices up and bond yields down.
Also, when expectations for future inflation are extremely low, this can create an “inverted yield curve.” Normally, longer-term bonds offer higher bond yields to entice investors. When the yield curve inverts, shorter-term bonds offer higher yields because investors expect yields to fall in the future.
This is where bond yields become a leading indicator for recession.
Where and How Are Bonds Traded?
Bond traders specialize in specific bond types: Treasuries, municipal bonds, or corporate bonds. Unlike the stock market, there is no centralized exchange for bonds. Trading is done over-the-counter (OTC) between broker-dealers and large institutions.
Nearly all average daily trading in the US bond market takes place OTC. However, a small number of corporate bonds are listed on exchanges. Bond trading prices and volumes are reported on FINRA’s Trade Reporting and Compliance Engine (TRACE).
Because of the lack of transparency, many investors are better off investing in bonds through mutual funds or ETFs rather than individual bonds.
The benchmark bond yields number you are most likely to see is the current yield of the 10-year Treasury. That number is published daily on [Treasury.gov].
The Bond Market Is Screaming “Inflation Is Entrenched”
Now let us look at what bond yields are screaming right now.
The global bond market selloff that began last week accelerated dramatically at the start of this week, sending bond yields across developed economies to multi-year highs. This is not a routine repricing. It is a structural signal that institutional investors no longer believe inflation is transitory.
The Numbers: Where Bond Yields Stand Right Now
US Treasury Yields (as of May , 2026)
- 2-year: ~4.08-4.10% (highest since March 2025)
- 10-year: ~4.58-4.63% (highest since February 2025)
- 30-year: ~5.10-5.16% (highest since 2007)
The 10-year bond yields briefly touched 4.63% in overnight trading Monday, its highest level since February 2025. The 30-year bond punched through 5.10% and touched 5.16%, territory it has not seen since before the 2008 financial crisis.
Global Contagion: This Is Not Just America
- Japan: 30-year JGB hit 4% for first time since 1999
- UK: 10-year gilt at highest since 2008
- Germany: Bund yields moved in sympathy
When Tokyo, London, Berlin, and Washington all sell off together on the same afternoon, institutional money is not having a bad day. It is sending a coordinated message about global bond yields.
The Yield Curve: Bearish Steepening Is the Dominant Signal
The yield curve is bear-steepening — long-end bond yields are rising faster than short-end yields. The gap between 2-year and 10-year yields is now approximately 52 basis points.
Bearish steepening means markets believe the Fed is “behind the curve” and inflation will persist. Term premium is rising. Investors demand more compensation for holding long-duration risk.
As Macquarie interest rate strategist Thierry Wizman put it:
“Looking at the bearish steepening in the bond market today, the narrative is one of the Fed potentially ‘falling behind the curve’ and the need to at least sound hawkish, even if it does not necessarily hike.”
Wizman added that if the Fed does not change its tone, bond yields could rise further:
“Market anxiety may suggest the need for Fed officials to change their tone ahead of next month’s FOMC meeting. If not, bond traders will conclude that the Fed is behind the curve. The US inflation risk premium could rise further and the yield curve could steepen even more.”
For more on [risk management during volatile markets], our guide covers position sizing when bond yields are spiking.
The Inflation Story: Oil Lit the Match
Oil prices spiked another 3% as President Trump stated his patience with Iran is running out. Progress on the Strait of Hormuz remains essentially zero. Crude is now trading well above 100/barrel, with Brent near 105 .
But here is the critical insight from bond traders: oil may have lit the match, but inflation had already soaked the curtains. Once energy costs migrate into services, shelter, logistics, and food, the “temporary” crowd needs to find a new hobby.
The inflation data that changed everything:
- CPI (April): 3.8% YoY (highest since May 2023)
- Core CPI (April): 2.8% YoY and accelerating
- PPI (April): 1.4% MoM (largest since March 2022)
- Annual PPI: 6.0% (highest since 2022)
The bond market’s conclusion: the energy shock is no longer contained at the gas pump. It has migrated into shelter, services, beef prices, and airfares. Bond yields are reflecting that reality.
The Fed Signal: Markets Are Pricing Hikes, Economists Are Skeptical
Bond yields are now pricing a ~50-64% probability of a rate hike by December 2026, and ~73-75% by April 2027. This represents a complete reversal. Before the Iran conflict began in late February, traders expected a series of rate cuts later in 2026.
But there is a divergence between what bond yields are pricing and what economists expect.
FHN Financial macro strategist Will Compernolle offered a caution:
“There’s really low trading volumes in the contracts for the middle of next year. I consider it a pretty low conviction signal from the market. The market might just be really hedging for the risk that a hike does eventually come.”
BCA Research Chief US Bond Strategist Ryan Swift added:
“The financial markets move very quickly to incorporate new information faster than the actual data. Sometimes the market’s picking up something right, and economists will eventually follow. But often, it’s just overreacting.”
The FOMC’s internal divergence confirms the tension. At the April 28-29 meeting (the last of the Powell era), the vote to hold rates was 8-4 — the most divided since 1992. Three members objected to retaining “dovish” wording in the statement.
What Bond Yields Mean for Other Assets
| Asset Class | Signal from Bond Yields |
|---|---|
| US Dollar (DXY) | Bullish. Higher yields attract foreign capital. |
| Gold (XAU/USD) | Bearish. Rising real yields increase opportunity cost. |
| S&P 500 | Warning. Narrow AI rally faces rising discount rates. |
| Risk Assets | Headwind. High oil prices + rising bond yields = bearish double whammy. |
As one strategist put it: “The bond market is the adult in the room, and it just cleared its throat loudly. Stocks can party at all-time highs, but yields decide when the lights come on.”
The Bottom Line for Traders
Bond yields are sending a clear and coordinated signal: inflation is no longer transitory, the Fed is behind the curve, and rates are heading higher — not lower.
- Is the market pricing hikes? Yes — ~50-70% chance of a 2026 hike.
- Is this an overreaction? Possibly. Economists say yes. But bond yields have been right before.
- What does this mean for the dollar? Bullish.
- What does this mean for gold? Bearish.
- What does this mean for stocks? Warning.
The bond market does not panic. It prices. And right now it is pricing in a world where the Strait of Hormuz does not reopen cleanly, where energy costs have already colonized shelter and services, and where the Fed has neither the political runway nor the economic cover to get aggressive.
Watch the 10-year bond yields. It leads everything else.
Disclaimer: This article is for educational and informational purposes only. It does not constitute financial advice, trading recommendations, or an offer to buy or sell any asset. Trading forex, commodities, indices, cryptocurrencies, and futures carries significant risk and may not be suitable for all investors. You can lose more than your initial deposit. Past performance does not guarantee future results. Always read full terms, contract specifications, and risk disclosures before trading. Do your own research. Consult a licensed financial advisor if you need professional investment advice.