


Support and Resistance: The Most Important Trading Concept
Support and resistance is the foundation of technical analysis. No matter what market you trade – forex, gold, oil, indices, or crypto – these levels act as the backbone of price behavior. Understanding support and resistance helps you identify potential entry and exit points, manage risk, and build trading strategies that are simple yet effective.
This complete guide covers everything you need to know about support and resistance. You will learn what these levels are, why they form, how to identify them, and how to trade them using three proven strategies. You will also learn the most common mistakes traders make with it and how to avoid them.
By the end of this guide, mastering support and resistance will become your edge in the markets.
For a deeper look at risk management strategies , this guide recommends reviewing how support and resistance levels help with stop placement.
Key Takeaways
| Concept | Summary |
|---|---|
| Support | A price floor where buying pressure stops a decline |
| Resistance | A price ceiling where selling pressure stops a rally |
| Role reversal | Broken support becomes resistance; broken resistance becomes support |
| Zones not lines | Treat levels as areas, not exact prices |
| Higher timeframes | Daily and weekly levels are stronger than intraday |
| Confirmation | Wait for price action signals before entering |
These takeaways form the foundation of trading support and resistance. The following sections will explain each concept in detail.
What Is Support in Trading?
Support and resistance starts with understanding support. A support level is a price where buying interest is strong enough to overcome selling pressure. It acts like a floor, preventing prices from falling further.
When price approaches a support level, buyers typically step in. They see value at that price and open long positions. This buying pressure pushes prices higher. The more times price bounces off a support level, the stronger that level becomes.
In an uptrend, support and resistance levels are constantly forming. Each pullback creates a new support level. Each new high creates a new resistance level. The reverse is true in a downtrend.
For more on trading with trendlines , this guide covers how diagonal support and resistance works in trending markets.
What Is Resistance in Trading?
Resistance is the opposite of support. A resistance level is a price where selling pressure is strong enough to overcome buying pressure. It acts like a ceiling, preventing prices from rising further.
When price approaches a resistance level, sellers typically step in. They see overvalued prices and open short positions or take profits on long positions. This selling pressure pushes prices lower. The more times price rejects a resistance level, the stronger that level becomes.
Understanding support and resistance means understanding both sides of the market. Every level is either a potential bounce or a potential break.
Why Support and Resistance Levels Form
Support and resistance levels form because of market psychology, supply and demand, and price memory.
Market psychology: Traders remember past highs and lows. When price returns to a level where it reversed before, traders expect the same reaction. This creates a self-fulfilling prophecy.
Supply and demand: At support levels, demand exceeds supply. Buyers want to buy, sellers are unwilling to sell lower. At resistance levels, supply exceeds demand. Sellers want to sell, buyers are unwilling to buy higher.
Price memory: Institutional traders place orders at key levels. Stop losses cluster beyond support and resistance zones. When price approaches these zones, orders get triggered, reinforcing the level.
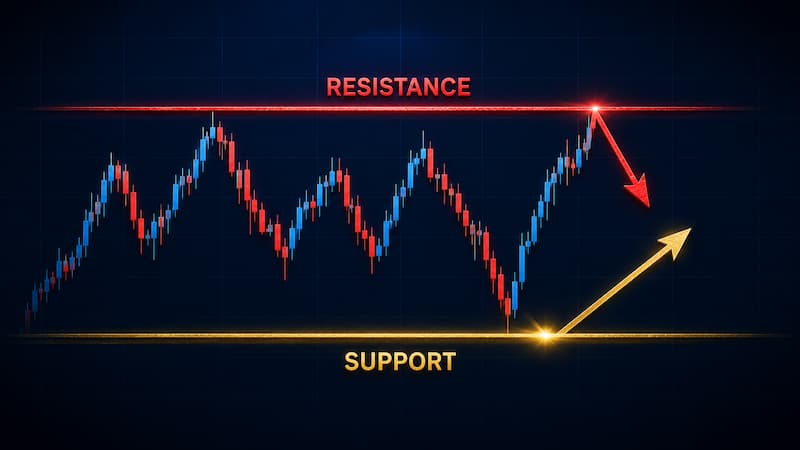
This is why support and resistance works across all markets and timeframes. The psychology does not change.
How to Identify Support and Resistance Levels
There are several methods for identifying support and resistance levels. The best traders use multiple methods to confirm their levels.
Horizontal Price Levels
The most straightforward method is to look for historical highs and lows. If price repeatedly bounces from a certain level, that level becomes support. If it stalls or reverses at a peak, that level becomes resistance.
For support and resistance identification, look for at least two touches before drawing a level. The more touches, the stronger the level.
Trendlines and Channels
Trendlines are diagonal support and resistance levels. In an uptrend, draw a line connecting higher lows. That line acts as dynamic support. In a downtrend, draw a line connecting lower highs. That line acts as dynamic resistance.
Channels combine both. An ascending channel has parallel support and resistance lines sloping upward. A descending channel has parallel lines sloping downward.
Moving Averages
Moving averages act as dynamic support and resistance levels. The 20-period, 50-period, and 200-period moving averages are the most commonly watched.
In an uptrend, price tends to find support at moving averages. In a downtrend, price tends to find resistance at moving averages. The longer the period, the stronger the level.
Fibonacci Retracements
Fibonacci retracements are horizontal support and resistance levels drawn between a high and a low. The key levels are 38.2%, 50%, and 61.8%.
These levels often act as support in an uptrend when price pulls back. They act as resistance in a downtrend when price retraces higher. Fibonacci levels are most powerful when they align with other support and resistance methods.
Round Numbers
Psychological levels like 1.0000 on EUR/USD or $100 on oil attract attention. Traders place orders at these “big figures,” creating natural support and resistance.
For example, gold traders watch $4,500 as major support and $4,800 as major resistance. The dollar index has 98.00 as support and 99.00 as resistance.
Major vs Minor Support and Resistance
Not all support and resistance levels are equal. Understanding the difference between major and minor levels is critical.
Minor levels are expected to break. In a downtrend, each minor low and the subsequent bounce creates a minor support level. The price will likely fall through it. In an uptrend, each minor high creates a minor resistance level. The price will likely break through it.
Minor support and resistance levels provide analytical insight. If price breaks a minor support level, the trend remains intact. If price stalls and bounces above a prior low, a range or trend change could be developing.
Major levels have recently caused a trend reversal. Where an uptrend reversed into a downtrend, that level becomes major resistance. Where a downtrend ended and an uptrend began, that level becomes major support.
When price returns to a major support and resistance level, it will often struggle to break through. The price may retreat from the level multiple times before eventually breaking. These are the levels that matter most for position entries and exits.
For more on understanding market structure , this guide covers how support and resistance fits into the bigger picture.
3 Simple Rules to Draw Support and Resistance Levels
Following these three simple rules will improve your support and resistance drawing significantly.
Rule No. 1: Price needs to get rejected at least twice from the level. One touch is not enough. Two touches suggest a meaningful level. Three touches confirm it.
Rule No. 2: The more rejections the level has, the more important it becomes. A level tested five times is stronger than a level tested twice.
Rule No. 3: Most recent rejections are more important than less recent rejections. A bounce from last week matters more than a bounce from last year.
These rules apply to both support and resistance identification. Use them consistently, and your levels will improve over time.
How to Use Support and Resistance in Trading
Once you have identified support and resistance levels, you can use them for several purposes.
Take profit: As price approaches a support level from above, short sellers may take profits. As price approaches a resistance level from below, long traders may take profits.
Establish new positions: When price approaches a support level, place buy limit orders near and above support. When price approaches a resistance level, place sell limit orders near and below resistance.
Establish positions on breakouts: When a support level breaks, initiate short positions expecting price to fall to the next lower support. When a resistance level breaks, initiate long positions expecting price to rise to the next higher resistance.
Stop-loss placement: A breach of a support and resistance level can signal a losing position should be exited. The signal to exit comes from the breach itself.
Role reversal: Once a support and resistance level is broken, its technical characteristic reverses. Broken support becomes resistance. Broken resistance becomes support. This is one of the most powerful concepts in trading.
3 Trading Strategies Based on Support and Resistance
Here are three proven strategies for trading support and resistance.
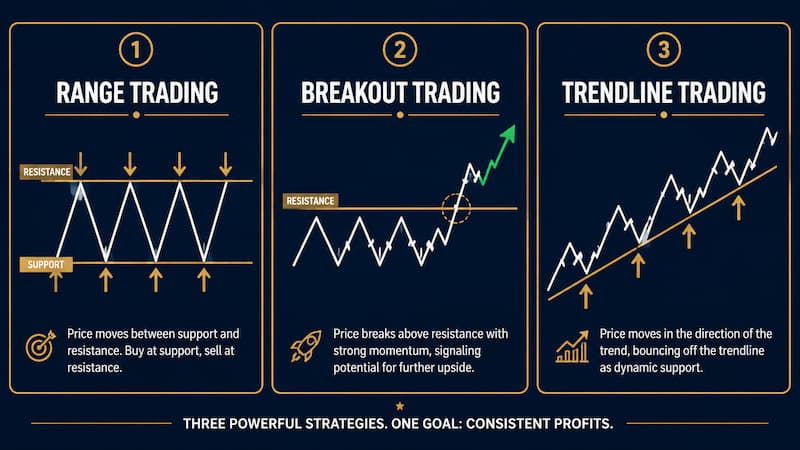
Strategy 1: Range Trading
Range trading occurs between support and resistance levels. Traders buy at support and sell at resistance.
In a sideways market, identify the range boundaries. Buy when price bounces off support. Sell when price stalls at resistance. Place stop losses below support when long and above resistance when short.
Support and resistance range trading works best in non-trending markets. It requires patience and discipline.
Strategy 2: Breakout Trading
Breakout trading aims to capitalize when price moves decisively through support and resistance levels.
After a period of consolidation, price often breaks out and starts a new trend. However, do not act immediately. Wait for a pullback to the broken level, which now acts as new support (or resistance), then enter in the breakout direction.
This approach to support and resistance trading reduces false breakouts and improves risk-to-reward ratios.
Strategy 3: Trendline Trading
Trendline trading uses diagonal support and resistance lines. In an uptrend, draw a line connecting higher lows. Buy when price bounces off the trendline. In a downtrend, draw a line connecting lower highs. Sell when price bounces off the trendline.
Trendline support and resistance works best in strong trends. When the trendline breaks, it signals a potential trend change.
Role Reversal: Old Support Becomes New Resistance
One of the most important concepts in support and resistance is role reversal.
When price breaks below a support level, that level becomes resistance on any retest. Sellers who missed the initial breakout place limit orders there. Buyers who got trapped exit their positions there.
When price breaks above a resistance level, that level becomes support on any retest. Buyers who missed the breakout place limit orders there. Sellers who got trapped exit their positions there.
This support and resistance phenomenon occurs because market participants remember the old level. Their orders create the reversal.
3 Support and Resistance Indicators
While support and resistance is primarily about price action, several indicators can help.
Fibonacci Retracements
Fibonacci retracements are horizontal support and resistance levels drawn between a high and a low. The 38.2%, 50%, and 61.8% levels are the most important. They work best when aligned with other support and resistance methods.
Pivot Points
Pivot points are calculated support and resistance levels based on the previous period’s high, low, and close. The central pivot point (PP), plus R1, R2, R3 (resistance) and S1, S2, S3 (support), provide daily levels many traders watch.
Moving Averages
Moving averages act as dynamic support and resistance levels. The 50-period and 200-period moving averages are the most widely followed. In uptrends, they act as support. In downtrends, they act as resistance.
Common Mistakes When Using Support and Resistance
Here are the most frequent mistakes traders make with support and resistance and how to fix them.
1. Treating levels as exact prices instead of zones. Price rarely stops at a single line. Fix: Mark zones using recent swing highs and lows. Add an ATR buffer to stops.
2. Ignoring higher timeframes. A level on a 5-minute chart may be irrelevant on the daily. Fix: Identify weekly and daily support and resistance first, then refine on lower timeframes.
3. Entering on the first touch without confirmation. Jumping in as soon as price hits a level increases false signals. Fix: Wait for a rejection wick, change of structure, or momentum divergence.
4. Placing stops directly on the level. Stops sitting exactly at the line are easy targets for noise. Fix: Place stops beyond the zone using ATR as a guide.
5. Drawing too many lines. Crowded charts create confusion. Fix: Keep only the most tested zones. Remove levels that have not influenced price recently.
6. Forgetting role reversal. Beginners often delete a level once broken. Fix: Track flip zones. Former resistance can become support after a clean break and retest.
7. Using the same position size regardless of level distance. A wide stop needs a smaller size than a tight stop. Fix: Size positions based on stop distance to keep risk constant at 1-2%.
8. No plan for invalidation or profit taking. Entering without clear exits leads to emotional decisions. Fix: Define both stop and target before entry. Scale out at nearby support and resistance levels.
Managing Risk with Support and Resistance
Support and resistance levels provide natural points for risk management.
Place stop-loss orders beyond levels: A stop placed just under support or just above resistance often gets hit by normal noise. Position stops slightly beyond the zone. Using ATR helps fine-tune this distance.
Use take-profit targets at nearby levels: If long from support, aim to take profit near resistance. If short from resistance, target support. This ensures you capture moves without holding too long.
Size positions based on distance to levels: A wide stop requires a smaller trade size to keep risk within limits. This protects your account regardless of the setup.
Adjust for timeframe differences: Daily support and resistance levels require wider risk buffers than intraday levels.
For more on position sizing and risk management , this guide covers the formulas for keeping risk constant across different stop distances.
Combining Support and Resistance with Market Structure
Support and resistance does not exist in isolation. It must be combined with market structure for the best results. Market structure refers to the overall trend – higher highs and higher lows (uptrend) or lower highs and lower lows (downtrend).
In an uptrend, focus on buying at support and resistance levels that align with the trend. Look for pullbacks to major support zones. These offer low-risk entry points because the trend is on your side. In a downtrend, focus on selling at resistance levels that align with the trend.
When support and resistance levels align with market structure, they become much more powerful. A support level in an uptrend is more likely to hold than a support level in a downtrend. A resistance level in a downtrend is more likely to hold than a resistance level in an uptrend. Always identify the trend before drawing your levels.
This combined approach – support and resistance plus market structure – is how institutional traders approach the markets. They do not trade levels in isolation. They trade levels that make sense within the broader context of trend, momentum, and volume.
For more on identifying market structure , this guide covers how to spot trend changes and key reversal points.
Bottom Line
Support and resistance is the most important concept in technical analysis. It works across all markets and timeframes. It provides structure to chaotic price action. It gives you clear levels for entries, exits, and stops.
The key to mastering support and resistance is practice. Draw levels every day. Review them after the market closes. Learn from your mistakes. Over time, your eye for key levels will improve.
Remember these rules: treat levels as zones, not exact prices. Respect higher timeframes. Wait for confirmation. Manage risk with stops beyond the zone. And never forget role reversal – broken support becomes resistance, and broken resistance becomes support.
Master support and resistance, and you master the markets.
Disclaimer: This article is for educational and informational purposes only. It does not constitute financial advice, trading recommendations, or an offer to buy or sell any asset. Trading forex, commodities, indices, cryptocurrencies, and futures carries significant risk and may not be suitable for all investors. You can lose more than your initial deposit. Past performance does not guarantee future results. Always read full terms, contract specifications, and risk disclosures before trading. Do your own research. Consult a licensed financial advisor if you need professional investment advice.