


Every investor faces the same question. Should you buy a stock because the company is strong, or because the chart says it is about to move?
This blog of the two approaches has been debated for over 150 years. On one side, fundamental analysis looks at balance sheets, earnings, and economic conditions. On the other, technical analysis looks at price charts, volume, and market psychology.
The truth is more nuanced. As HSBC analysts have noted, the most successful investors often combine both methods. This guide will explain each approach, their pros and cons, what the professionals say, and how to use both in your own trading.
A proper thesis of any investment opportunity should consider multiple angles. That is the philosophy behind this guide. Let us dive in.
What Is Fundamental Analysis?
Fundamental analysis is a method of evaluating a security by attempting to measure its intrinsic value. It examines economic, financial, and qualitative factors.
This type of approach looks at macroeconomic conditions (the overall economy and industry trends) and company-specific factors (financial health, management quality, competitive position). The goal is to find a stock trading below its intrinsic value – a bargain.
As defined by Investopedia, fundamental analysis studies “macroeconomic factors and individually specific factors including financial condition and management of companies.” The assumption is that a stock’s price will eventually return to its proper value based on these fundamentals.
For a deeper look at [understanding economic indicators], this blog recommends reviewing how GDP, inflation, and jobs data affect valuations.
What Is Technical Analysis?
Technical analysis is a method of evaluating securities by relying on the assumption that market data – charts of price, volume, and open interest – can help predict future market trends.
Unlike fundamental analysis, the intrinsic value of the security is not considered. Technical analysts believe that historical price patterns repeat because market psychology is consistent. Fear and greed cycle through generations of traders.
According to the CFA Institute, technical analysis “makes the assumption that market psychology influences trading in a manner that allows an analyst to predict when a stock will rise or fall.” This is why many technical analysts are also market timers.
For more on [support and resistance levels], this blog recommends understanding how technicians identify entry and exit points.
The Core Difference: What vs When
The simplest way to understand the difference is this. Fundamental analysis tells you what to buy. Technical analysis tells you when to buy it.
| Fundamental Analysis | Technical Analysis |
|---|---|
| What to buy | When to buy |
| Long-term horizon | Short-term horizon |
| Intrinsic value | Price patterns |
| Financial statements | Charts and volume |
| Macro + micro factors | Market psychology |
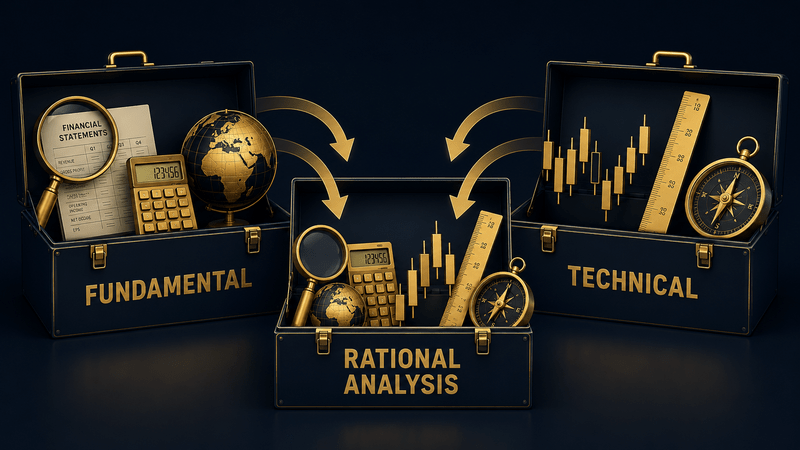
As John Bollinger, CFA, CMT, creator of Bollinger Bands, puts it: “Rational analysis is made up of the finest fundamental tools and the finest technical tools. If you have two toolboxes, one labeled ‘tools for red cars’ and the other ‘tools for blue cars,’ what would you do if you wanted to work on a white car? The rational approach would be to use the best tools from each box.”
This analysis adopts that rational approach.
Pros and Cons of Each Approach
Fundamental Analysis – Pros
| Pro | Why It Matters |
|---|---|
| Based on quantitative data | Eliminates personal bias |
| Considers macroeconomic factors | Comprehensive view |
| Builds industry understanding | Helps detect red flags |
Fundamental Analysis – Cons
| Con | Why It Matters |
|---|---|
| Time-consuming | Requires constant monitoring |
| Requires deep knowledge | Data interpretation takes skill |
| Ignores market psychology | Herd behavior can override fundamentals |
Technical Analysis – Pros
| Pro | Why It Matters |
|---|---|
| History tends to repeat | Patterns can signal opportunities |
| Requires less data | Faster than fundamental research |
| Includes human interpretation | Captures market sentiment |
Technical Analysis – Cons
| Con | Why It Matters |
|---|---|
| Pattern delay | Late signals can miss moves |
| Contradictory indicators | Different patterns can conflict |
| Subject to bias | Human interpretation varies |
This blog acknowledges that both methods have weaknesses. The key is knowing when to use each.
The Efficient Market Debate
At the heart of the controversy is the efficient market hypothesis. Proponents of strong-form efficiency believe that all information is already reflected in the current price. If that is true, neither fundamental nor technical analysis can generate above-average returns.
As Christopher Orndorff, CFA, managing principal at Payden & Rygel, told the CFA Institute: “We don’t think that’s entirely accurate. We think all markets are sometimes inefficient. People miss things. The last couple of years are a great example, both the up and down movements.”
Technical analysts have long argued that markets are not fully efficient. They believe that price patterns emerge because human behavior is predictable. Fear and greed follow cycles. Those cycles leave footprints in the charts.
For a deeper look at trading psychology, this blog recommends understanding how emotions drive market cycles.
What the Professionals Say: HSBC and the CFA Institute
Major financial institutions have weighed in on this debate. HSBC analysts have noted that combining both approaches often yields better results than relying on one exclusively. Fundamental analysis identifies the right assets. Technical analysis times the entry and exit.
The CFA Institute has published extensive research on both methods. In a 2003 CFA Magazine article, several practitioners shared their views.
Andreas Sauer, Ph.D., CFA, managing director at UNION PanAgora in Frankfurt, said: “In general, I believe that fundamental analysis has more value than technical analysis because it provides a much deeper framework for valuing stocks or bonds than just looking at patterns in past price movements.” But he also admitted, “We employ momentum and reversal factors in all of our own equity and bond models.”
Orndorff added: “We use both technical and fundamental analysis for both fixed income and equity. Fundamental analysis really drives the decision of which securities we want to own. But the timing of purchase and sale decisions is split pretty evenly between technical and fundamental.”
This guide shows that even CFA charterholders who prefer fundamental methods still use technical indicators. The debate is not about choosing one. It is about how much weight to give each.
Quantitative Analysis: The Third Way
The technical analysis community has split in the last 20 years. A large piece has cleaved off and now calls themselves quantitative analysts, or quants.
As Bollinger explains: “They took a large body of knowledge from the technical approach, made it rigorous, fired it up with higher math and statistical power, and incorporated parts of fundamental analysis. Some use relative strength with ideas like alpha, earnings growth, and cash flow.”
Quantitative analysis is statistically based. It uses excess return forecasting and fundamental indicators such as earnings trends and growth rates. Unlike traditional technical analysis, quants rely on automated algorithms and backtesting.
Edward Best, CFA, managing director at Trusco Capital Management, told the CFA Institute: “We don’t use technical analysis, we use quantitative. Quantitative is statistically based. We use excess return forecasting and fundamental indicators.”
This guide notes that the lines between these approaches are blurring. Many professionals today use a hybrid model.
A Real-World Example: Gold and the Dollar
Let us apply this analysis to a real asset: gold.
A fundamental analysis of gold would consider central bank buying, real interest rates, inflation expectations, and geopolitical risk. It would conclude that gold has structural support. But it would not tell you when to buy.
A technical analysis of gold would look at support at $4,500 and resistance at $4,800. It might identify a breakout pattern. But it would not tell you why gold might move.
A combined analysis would do both. Fundamental analysis identifies the bullish case. Technical analysis identifies the entry level. That is the hybrid approach.
For more on gold market analysis, this guide covers the key levels and correlations.
The Hybrid Approach: Rational Analysis
Bollinger coined the term “rational analysis” almost 20 years ago. It means using the finest tools from both fundamental and technical analysis.
How does this work in practice?
| Step | Method | Action |
|---|---|---|
| 1 | Fundamental | Identify undervalued assets with strong prospects |
| 2 | Technical | Wait for a favorable entry signal (support, breakout) |
| 3 | Risk management | Set stop losses based on technical levels |
| 4 | Fundamental | Monitor earnings and economic data for changes |
| 5 | Technical | Exit when technicals signal a reversal |
This analysis recommends this hybrid approach for most traders. It gives you the best of both worlds.
Which Strategy Is Right for You?
The answer depends on your goals and time horizon.
| If you are… | Then prioritize… |
|---|---|
| A long-term investor | Fundamental analysis |
| A short-term trader | Technical analysis |
| A portfolio manager | Both (hybrid approach) |
| A beginner | Start with fundamentals, add technicals later |
A good way to sum this up comes from the first source in this guide: fundamental analysis tells us where to invest, while technical analysis indicates the best time to enter or exit the market.
Common Mistakes Beginners Make
| Mistake | Why It Hurts |
|---|---|
| Over-reliance on one method | Missing half the picture |
| Ignoring fundamentals in a crash | Selling quality assets at panic prices |
| Ignoring technicals in a bubble | Buying at the top |
| Using too many indicators | Analysis paralysis |
| No risk management | Small losses become large |
This blog recommends starting simple. Master one method. Then add the other. Do not try to learn everything at once.
For more on risk management strategies, this guide covers position sizing and stop losses.
Why Most Beginners Get This Wrong
A common mistake in this analysis is assuming that one method is superior to the other. Beginners often fall into one of two traps.
The first trap is fundamental-only analysis. An investor buys a stock because the company has strong earnings, low debt, and a great management team. But they buy at the wrong time – during a market peak or ahead of a sector rotation. The stock drops 20% despite the strong fundamentals. They panic and sell.
The second trap is technical-only analysis. A trader sees a breakout pattern on the chart and buys. But they have no idea whether the company is profitable, whether the industry is growing, or whether the macro environment supports the move. The pattern fails because the fundamentals were deteriorating. The trader loses money.
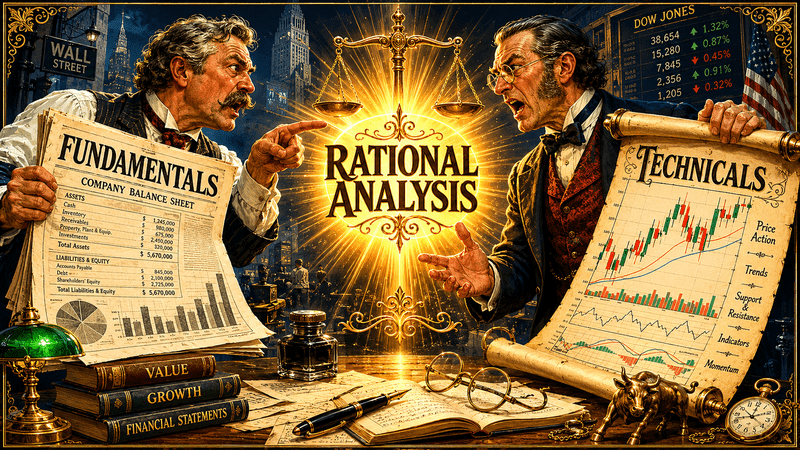
A proper analysis avoids both traps. Fundamental analysis identifies the right assets. Technical analysis identifies the right time. Neither works well alone. This analysis has shown that the most successful investors combine both. They do not pick a side. They pick the best tool for the job.
As John Bollinger, creator of Bollinger Bands, told the CFA Institute: “If you have two toolboxes, one labeled ‘tools for red cars’ and the other ‘tools for blue cars,’ what would you do if you wanted to work on a white car? The rational approach would be to use the best tools from each box.”
That rational approach is what separates professionals from amateurs.
Bottom Line
The debate between fundamental and technical analysis has lasted 150 years. It will not end today. But the most successful investors have learned that both approaches have value.
Fundamental analysis tells you what to buy. Technical analysis tells you when to buy it. Quantitative analysis adds statistical rigor. The best approach is rational analysis – using the finest tools from each box.
As Orndorff said, “We think all markets are sometimes inefficient. People miss things.” Your job as an investor is not to pick a side. It is to use every tool available to find opportunities and manage risk.
That is the bottom line of this guide.
Disclaimer: This article is for educational and informational purposes only. It does not constitute financial advice, trading recommendations, or an offer to buy or sell any asset. Trading forex, commodities, indices, cryptocurrencies, and futures carries significant risk and may not be suitable for all investors. You can lose more than your initial deposit. Past performance does not guarantee future results. Always read full terms, contract specifications, and risk disclosures before trading. Do your own research. Consult a licensed financial advisor if you need professional investment advice.