


The Hidden Account Killer
Traders are in love with indicators, strategies, or the ideal entry. But let me tell you the secret that quietly kills more trades than a poor strategy: pair correlation ignorance.
If you’re trading EUR/USD and GBP/USD concurrently, believing you’re diversifying — you’re fatally wrong. If you’re shorting USD/JPY and hedging USD/CHF without understanding how they correlate with each other — you’re risking Russian roulette with your money.
Learning about forex pair correlation isn’t only beneficial — it’s essential. You’re not trading if you don’t; you’re betting.
You can feel diversified and be heavily concentrated at the same time. That is the trap of correlation risk. When you hold several positions that tend to move together, you have not spread your risk across several bets; you have made the same bet several times.
Two highly correlated trades are not two trades, they are one bet at roughly double the size. A portfolio of correlated positions can quietly carry far more risk than the trader believes, because the diversification is an illusion. The danger is that it feels safe right up until everything moves against you at once.
For more on [risk management strategies], our guide covers how to protect your capital from hidden risks.
What Is Pair Correlation in Forex?
Pair correlation is a statistical correlation between two currency pairs. Put simply, it informs you of how two forex pairs correlate with one another in a precise manner.
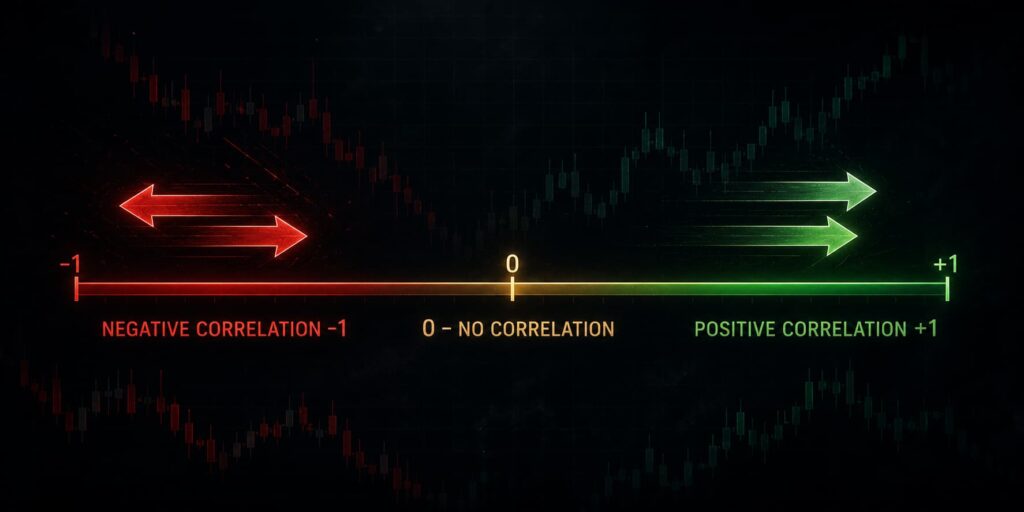
Correlation is on a scale from -1 to +1:
| Value | Meaning |
|---|---|
| +1 | Both pairs move the same way |
| -1 | They move in opposite directions |
| 0 | There’s no correlation whatsoever |
According to FBS – Currency Correlation Guide , understanding these relationships is essential for proper risk management, as trading correlated pairs without knowing their relationship can double or triple your risk exposure without you realizing it.
Why Do You Care About Correlation?
Because correlated trades can double your risk exposure without you even knowing it.
Consider this:
- You long EUR/USD and you long GBP/USD
- Both are positively correlated
- If the dollar surprises stronger, both trades crash
- You just doubled down on the same theory
Now consider this:
- You buy USD/JPY and sell USD/CHF
- They are negatively correlated
- One wins, the other loses
Your net gain? Zero. Your effort? Wasted.
That’s the power — and danger — of pair correlation.
The Hidden Danger of Correlated Trades
Here is one very common problem that hurts many traders, even those who have a good strategy. The problem is that there is a hidden risk caused by correlated trades.
You may think that you are taking several different trades, but in reality, you may be making the same bet several times. Then, if the market moves against you, all those trades can lose together and damage your equity very, very quickly.
The worst part is that many traders do not even realize that this is happening.
This matters enormously for risk management, because the whole point of holding multiple positions is usually to avoid putting all your risk in one place. Correlation defeats that silently. You think you are running five modest trades; you are actually running one large one wearing five costumes.
When the underlying driver turns, all five lose together, and the combined loss can dwarf what you thought any single position could cost you.
A trader who feels diversified can be dangerously concentrated. That is the trap of correlation risk.
For more on [trading psychology and discipline], our guide covers the mental discipline required to avoid hidden risks.
Positive Correlation Explained
There is something called positive correlation, and there is also negative correlation. Let’s start with positive correlation.
It does not happen all the time, but at certain times, some markets correlate quite heavily, which means that they move in the same direction. If you compare these two charts, which are AUD/USD and NZD/USD, you can see that they correlate quite heavily in certain areas of the chart.
Why This Matters:
Imagine being in a long trade on AUD/USD with support at a certain level, and also a long trade on NZD/USD with support at a similar level. You enter both trades simultaneously. You are now in two trades that are correlating heavily.
If you take a stop loss on both trades because the price shoots past those levels, you are taking double damage, even though those trades are more or less identical. If you take trades like this, they can cause a stronger drawdown.
Key Insight: When trading positively correlated pairs, you are effectively doubling your exposure to the same directional move.
Negative Correlation Explained
Now let me show you what negative correlation is. It is basically the same as positive correlation, only reversed. There are certain instruments that correlate negatively. Very often, it is EUR/USD and USD/CHF. They frequently move in opposite directions.
How It Works:
When EUR/USD moves downwards, USD/CHF often moves upwards. This is negative correlation. If the markets correlate like this and you happen to be in a long trade on EUR/USD and, at the same time, a short trade on USD/CHF, the market can move against you in both cases, and you are again taking double damage.
Do you see how risky this is?
According to Benzinga – Currency Correlation Pairs , EUR/USD and USD/CHF have one of the strongest negative correlations in the forex market, often exceeding -90%. Trading both simultaneously without accounting for this correlation is a common mistake that leads to unnecessary risk.
Key Insight: Even when trading in opposite directions, negative correlation can create hidden concentration if you’re not careful.
Triple Damage – The Real Danger
Now, what about triple damage? This is where it gets really serious and dangerous.
Here, we have three markets. Imagine a trade in which we are:
- Long GBP/USD
- Long AUD/USD
- Short USD/CAD
If you take these three trades, you are taking triple damage. With trades like these, a drawdown can happen very quickly.
Why It’s So Dangerous:
When one currency strengthens or weakens across the board, all three trades move together. If you are trading like this and you see one currency strengthening or weakening across the board while you also have trading levels that you would like to trade, you should reduce your risk. It is very likely that all those trades — in this example, all three trades — will have the same result.
All of them are likely to be winners, or all of them could be losers.
Key Insight: Triple damage is not a theoretical risk. It is a real danger that can wipe out weeks of profits in a single session.
Why Correlation Concentrates Hidden Risk
The risk correlation creates is hidden precisely because each individual position looks reasonable. You sized each trade to a comfortable risk, so no single one alarms you. But because they move together, their risks add up rather than offsetting, and the total exposure to the shared driver can be several times what you would ever knowingly put on a single idea.
The danger is invisible at the level of each trade and only appears when you sum the correlated group as the one bet it really is.

Risks Add Up Instead of Offsetting
The mechanism is that correlation removes the offsetting that real diversification provides. In a genuinely diversified set, a loss in one position is often cushioned by a gain in another. In a correlated set, there is no cushion; the losses pile on top of each other.
So the same number of positions that would be relatively safe if independent becomes a concentrated risk when correlated, because nothing is working in the other direction.
They All Lose on the Same Day
The moment correlation bites is when the shared driver moves against the group, and it does so to all of them at once. There is no staggering, no diversification benefit, just a simultaneous loss across every correlated position.
Because traders tend to account for positions one at a time, the size of that combined hit is usually a surprise, which is exactly why correlation risk ends accounts that felt diversified right up until the bad day.
| Correlation between positions | What you really hold | Effective risk |
|---|---|---|
| High, they move together | The same bet repeated | Concentrated, the risks add up |
| Low or none, independent | Genuinely separate bets | Spread, a loss can be offset |
| Negative, move opposite | A partial hedge | Reduced |
Key Insight: Treat highly correlated positions as one position when you set your total risk.
Where Correlation Hides
Correlation is dangerous partly because it is not always obvious. The clearest case is holding several positions in the same instrument or sector, where the link is plain. But correlation also hides in less visible places:
- Different tickers driven by the same macro factor
- Instruments tied to the same commodity or interest-rate move
- A basket of trades that all express the same underlying theme
On the surface they look like different bets; underneath, they share a single driver.
Same Driver, Different Names
The trap to watch for is positions that are nominally different but functionally the same. A handful of stocks in the same sector, several instruments sensitive to the same economic release, or multiple trades expressing one directional view on the market are all, in risk terms, close to a single bet.
The names differ; the exposure does not. Always ask what actually drives each position, not just what it is called.
Why Counting Tickers Misleads
Counting how many different positions you hold tells you nothing about your real diversification, because it ignores how they move together. The meaningful question is how many genuinely independent bets you have, which is often far fewer than your position count.
A list of five names that all move with one driver is, for risk purposes, one bet. Treating it as five is the error correlation risk punishes.
Key Insight: You cannot judge diversification by counting tickers.
Correlation Changes Over Time
Correlation changes over time and is different on different time frames. Strong correlation very often occurs during macro news and important events that affect one currency.
During Macro News
During macro news, what usually happens is that one currency strengthens or weakens. This causes all the pairs in which that currency is present to move up or down. Everything is driven by that one currency affected by the macro news. This is when strong correlation occurs very often.
Highly Correlated Pairs
There are also some trading instruments and forex pairs that typically correlate heavily even when there is no macro news. Some of the most important ones include:
- EUR/USD and USD/CHF – Very strong negative correlation (-94%)
- XAU/USD and USD/JPY – Strong negative correlation
- AUD/USD and USD/CAD – Strong negative correlation (-76%)
Correlation Ranges from -100% to +100%
A reading of -94% is almost -100%. It is very close to it, which means that the negative correlation is very strong. It is worth keeping this in mind when you are trading these instruments.
Key Insight: Correlation is not static. It changes with market conditions, timeframes, and macro events. Always check current correlation before entering multiple positions.
How to Manage Correlation Risk
Managing correlation risk comes down to sizing for the bet you are actually making rather than the number of positions you happen to hold.
The Checklist
| Step | Action |
|---|---|
| 1 | Identify the shared driver. Ask what actually moves each position, not just what it is called. |
| 2 | Treat correlated positions as one. Size the whole correlated group as a single bet for total risk. |
| 3 | Cap your exposure to any one driver. Limit how much total risk rides on a single underlying force. |
| 4 | Seek genuinely independent bets. Real diversification needs positions that do not move together. |
| 5 | Count independent bets, not tickers. Judge your concentration by drivers, not by the length of your position list. |
The TradeFundrr Standard: Count the Bet, Not the Tickers
Correlation risk is the quiet way a trader who feels diversified ends up concentrated, because positions that move together are not separate bets but one bet repeated. The risk hides at the level of each comfortable-looking position and reveals itself all at once when the shared driver turns.
The fix is to size for the real bet, not the ticker count.
How to Size for the Real Bet
Treat the Correlated Group as One Position
The single most useful habit is to mentally collapse correlated positions into one and size the group to the risk you would allow for a single bet.
If three trades move together, their combined risk should fit within your normal risk for one position, not three. This keeps your true exposure to any one driver within your limits, which is exactly what correlation risk otherwise sneaks past.
Size the bet, not the tickers.
Reduce Your Trading Volume
What you do when you see something like this happening is lower your trading volume. Reduce it to 50%.
If three trades are likely to be triggered at the same time and the markets are clearly correlating, use only 50% positions. If you normally risk 2% per trade, risk only 1% of your equity per trade.
Quick Thinking Required
Keep in mind that this requires quick thinking. You need to detect that there is correlated movement, which is very often driven by one currency. If you see one currency strengthening or weakening across the board while you also have trading levels that you would like to trade, reduce your risk.
Key Insight: Correlated trades often have the same result. All are likely to be winners, or all could be losers. This is how you can prevent large drawdowns and reduce your risk.
Conclusion: Count the Bet, Not the Tickers
Two trades can secretly be one bet. A screen that looks diversified can be dangerously concentrated.
Correlation is the quiet way a trader who feels diversified ends up concentrated. Positions that move together are not separate bets — they are one bet repeated.
The risk hides at the level of each comfortable-looking position and reveals itself all at once when the shared driver turns. In a funded account, this can mean a single move that breaches a limit the trader thought was spread across independent trades.
The fix:
| Action | Why |
|---|---|
| Size for the real bet | Not the ticker count |
| Count independent bets | Not positions |
| Cap exposure to any single driver | Protect your account |
| Seek genuinely independent bets | Real diversification |
The bottom line:
You can feel diversified and be heavily concentrated at the same time. That is the trap of correlation risk.
When you hold several positions that tend to move together, you have not spread your risk across several bets; you have made the same bet several times.
Two highly correlated trades are not two trades — they are one bet at roughly double the size. A portfolio of correlated positions can quietly carry far more risk than the trader believes, because the diversification is an illusion.
The danger is that it feels safe right up until everything moves against you at once.
Learn to count independent bets rather than positions, and to cap your exposure to any single driver. This is a risk skill that protects you from a concentration you would otherwise not see.
Disclaimer
This article is for educational and informational purposes only. It does not constitute financial advice, trading recommendations, or an offer to buy or sell any asset. Trading forex, commodities, indices, cryptocurrencies, and futures carries significant risk and may not be suitable for all investors. You can lose more than your initial deposit. Past performance does not guarantee future results. Always read full terms, contract specifications, and risk disclosures before trading. Do your own research. Consult a licensed financial advisor if you need professional investment advice.