


How to Read the Economic Calendar Like a Pro
The economic calendar is the single most important tool on my screen. I check it every morning before I look at a single chart. Without it, you are trading blind. With it, you can see the storms coming before they hit.
Here is my honest economic calendar discipline. Filter to your traded currencies and high-importance events only. Read the consensus and prior figure before the release. Pre-set scenarios rather than directional positions. Trade the follow-through after the spike has settled. Read individual events as part of the trailing series rather than in isolation.
Below, I break down every major event category, how to rank importance, the difference between pre-positioning and reaction trading, and the broker setup that converts economic calendar awareness into actual edge.
If you have ever been caught off guard by a sudden market move, chances are an economic calendar event was behind it. This guide will make sure that never happens again.
For a deeper look at how to trade NFP and major events , this guide complements the economic calendar framework.
The Star System: What Three Stars Actually Mean
Most economic calendar platforms use a star rating system. One star, two stars, three stars. But what do they actually mean?
One star: Low impact. The market barely reacts. These events are background noise. Do not trade them. Do not plan around them. They will not move your P&L.
Two stars: Moderate impact. The market might move 10-30 pips. Sometimes worth watching, but rarely worth trading. I monitor them for context but I do not base trades on them.
Three stars: High impact. This is where the money is made and lost. Three-star economic calendar events can move markets 50-150 pips in minutes. NFP, CPI, FOMC – these are three-star events. This is what you should be trading.
The mistake most traders make is treating all three-star events as equal. They are not. An FOMC meeting with a dot plot is more important than a regional manufacturing survey. A US NFP print is more important than a German CPI print. Rank your economic calendar by what actually moves your markets.
Key Takeaways
- Three-star events move markets; two-star and below are background noise unless they signal a regime change
- Market reaction depends on surprise vs consensus, not the absolute level
- Pre-position scenarios, not directional positions, before three-star events
- Trade the follow-through 30-60 minutes after the release, not the initial spike
- Cross-reference multiple economic calendar sources; the underlying data is the same but importance rankings vary
- FOMC SEP meetings (March, June, September, December) carry the most market sensitivity
How to Filter Your Economic Calendar (Step-by-Step)
An economic calendar shows hundreds of events every month. You cannot trade them all. You should not try.
Here is how I filter my economic calendar every week.
Step 1: Select your countries. I trade the US dollar, the euro, the pound, and the yen. I filter my economic calendar to only show events from the US, Eurozone, UK, and Japan.
Step 2: Select high impact only. I slide the volatility filter to only show three-star events. Two-star and one-star events are noise.
Step 3: Select your categories. I focus on central banks, inflation, and labour data. Everything else is secondary.
Step 4: Note the release times. I add the three-star events to my phone calendar with alerts 15 minutes before the release.
Step 5: Review the consensus and prior. The night before each event, I write down the consensus, the prior, and my scenarios.
This filtering process takes 10 minutes on Sunday night. It saves me hours of confusion during the week.
Why Most Traders Misuse the Economic Calendar
I see two common patterns among traders who lose money around economic calendar releases.
First: trading every event on the calendar. Most economic calendar platforms rank an obscure regional housing data series alongside FOMC decisions. They are not the same. Trading every three-star event is exhausting, and the marginal edge per event is low. The cumulative result is over-trading and burnout.
Second: pre-positioning directionally before three-star events. Taking a long-EUR position before NFP because you “think jobs will be weak” is gambling on a 50-50 outcome. I have done it. I have lost money doing it. A hawkish surprise can spike 100 pips against you in seconds. The risk-reward is structurally unfavourable.
I do not pre-position directionally anymore. I react to the print. This guide assumes you want to use the economic calendar for actual edge rather than for the illusion of being informed. The discipline matters more than the data.
The primary sources for economic calendar data are the official agencies: the US Bureau of Labor Statistics for employment and inflation data, the Federal Reserve for FOMC decisions, and FRED economic data for historical series.
Event Categories and How to Rank Them
I group economic calendar events into five categories based on how much they actually move markets.
| Category | Examples | Typical Reaction | How I Trade It |
|---|---|---|---|
| Central bank decisions | FOMC, ECB, BoE, BoJ, RBA, RBNZ | 50-150+ pips | I trade every FOMC and most ECB/BoE meetings |
| US labour data | NFP (first Friday), JOLTS, jobless claims | 30-100+ pips on NFP | High focus on NFP only |
| Inflation prints | CPI (US, UK, EU, JP), PPI, PCE | 30-80 pips on US CPI | High focus on US CPI |
| Growth indicators | GDP quarterly, ISM PMI monthly | 20-50 pips | Medium; trade only if surprise is meaningful |
| Secondary data | Housing, consumer confidence, durable goods | Usually under 20 pips | Ignore unless signalling a regime shift |
My primary economic calendar focus is the central-bank-and-inflation-and-NFP trio. Everything else is secondary. If you watch every release on the economic calendar equally, you are diluting your attention across data that does not consistently move markets.
For a deeper look at trading around central bank events , this guide covers my reaction trading playbook.
Reading Consensus, Prior, and Actual
Three numbers matter on every economic calendar release. Get these wrong, and you will misread the market every time.
Consensus: the median forecast of analysts surveyed before the release.
Prior: the previous figure (sometimes the originally-reported figure, sometimes the revised figure after subsequent revisions).
Actual: the figure announced at the release moment.
Here is what most traders miss. The market reaction depends on actual vs consensus, not on actual alone. A weak headline NFP that beats a weaker consensus is actually hawkish. A strong headline that misses a stronger consensus is actually dovish.
I learned this the hard way. Early in my trading, I saw a strong NFP number and bought dollars immediately. The dollar dropped. I was confused. Then I realised the consensus was even stronger. The number was a miss relative to expectations. The market sold the dollar.
Always read the revision too. NFP from the previous month gets revised this month. A strong current-month figure alongside an 80K downward revision to the prior month is cumulatively less hawkish than the current figure alone suggests.
Pre-Positioning vs Reaction Trading
There are two ways to trade economic calendar events. I have done both. Only one works consistently.
Pre-positioning means taking a directional position before the release based on a view of which way the surprise will land. You are betting on the direction of the data before the data is known. I have done this. I have lost money doing this. The consensus range is wide enough that surprises can land either way. You are essentially gambling on a 50-50 outcome with asymmetric downside risk.
Reaction trading means waiting for the release, reading the print, then trading the directional follow-through over the next 1-4 hours. You are using known information to take a position with cleaner edge.
I do reaction trading. I do not pre-position directionally on three-star events anymore. The risk-reward is structurally unfavourable.
Here is a real example. In May 2025, NFP came in at 172K against an 85K consensus. That was a massive beat. The dollar ripped through 100. I did not pre-position. I waited 30 minutes, watched the dollar hold above 99.50, and entered long. That is reaction trading.
For a deeper look at how the Fed shapes the dollar , this guide covers the transmission channels from FOMC decisions to FX.
The Release-Moment Execution Problem
Here is something most courses will not tell you. The first 60 seconds after a three-star economic calendar release is the worst execution window of the trading day.
Three things happen in those first 60 seconds.
First, the official data is published and processed by news terminals in milliseconds.
Second, algorithms execute pre-programmed trades in the first 1-5 seconds.
Third, retail platforms show the new figure with delay, and spreads widen dramatically.
I have watched spreads widen from 1 pip to 10 pips in the first minute after NFP. I have seen limit orders fail to fill. I have seen market orders slip 30 pips.
My standing rule: never trade the first 60 seconds. Wait for the spread to normalise. Typically 2-3 minutes after release. Then place your entries.
The 15-Minute Rule: Why I Wait
Even after the spread normalises, I do not jump in immediately. I wait 15 minutes.
Why? Because the first 15 minutes after a major economic calendar release is pure chaos. Algorithms are fighting each other. Liquidity is thin. The price can spike 50 pips one way, then reverse 80 pips the next minute.
I learned this lesson trading CPI last year. The print came in hot. Gold dropped $50 in two minutes. I shorted. Then gold reversed $80. I got stopped out. The market was reacting to the headline, then it started reacting to the details.
Now I wait 15 minutes. I let the market digest the data. I let the algorithms finish their battle. Then I look for a retest of a key level.
The 15-minute rule has saved me more money than any indicator.
What to Do When You Miss the Move
You will miss the initial move sometimes. It happens to everyone. You are in a meeting. You are away from your screen. You just hesitate.
Do not chase. I have chased. It ends badly every time.
If you miss the initial spike after an economic calendar release, wait for a pullback. Markets rarely move in a straight line. After a big spike, price often retraces 30-50% of the move. That retracement is your second chance.
I have a simple rule. If I miss the first 30 minutes after a release, I do not trade it. I wait for the next session. The London open. The New York open. There is always another opportunity.
Chasing a move after you have missed it is revenge trading. It is emotional. And it will cost you money.
The FOMC Week: How I Read It
FOMC weeks are different from any other week on the economic calendar. The Federal Reserve meets eight times per year. Each meeting is two days. The Statement releases on the second day, followed by the Chair press conference.
Four of those eight meetings (March, June, September, December) include the Summary of Economic Projections, which includes the “dot plot” showing where committee members expect rates to go. These SEP meetings move markets more than non-SEP meetings because the dot plot itself often matters more than the rate decision.
Here is my FOMC week routine.
Monday: read the pre-meeting consensus on the rate decision and the SEP forecasts.
Tuesday: monitor for any speeches from Fed officials that might shift expectations.
Wednesday (decision day): no fresh positions before the release. Read the Statement. Listen to the press conference in full. The Q&A often contains more market-moving information than the prepared remarks.
Thursday and Friday: trade the follow-through. Not the same-day spike.
I learned this after getting wrecked on a same-day FOMC trade. The spike reversed 15 minutes later and I was on the wrong side. Now I wait.
The Events I Monitor but Do Not Trade
Not every event on the economic calendar is worth trading. Here is what I monitor as context but rarely trade directly.
Weekly jobless claims (Thursdays): useful for understanding labour market trends, but rarely moves currencies by itself unless it diverges significantly over multiple weeks.
ISM manufacturing and services PMI: useful for growth direction, but the market reaction is usually modest unless the figure crosses the 50 threshold (expansion vs contraction).
Consumer confidence indices: useful for sentiment context, but market reaction is small.
Housing data: sector-specific. Minimal currency impact.
Trade balance figures: generally non-market-moving for major currencies.
I monitor these for the bigger picture. I do not trade them directly. The real edge is in the high-importance events, not in trading every release on the economic calendar.
How I Integrate the Economic Calendar into My Trading Week
Here is my actual weekly routine with the economic calendar.
Sunday: review the upcoming week’s economic calendar. Identify three-star events. Set alerts. Plan no positions across major releases unless I am reaction trading.
Each trading day: check the day’s three-star events at the start of the session. Note anything that could trigger volatility during my trading window.
Pre-release (60 minutes before three-star events): note the consensus, the prior, and the revision risk. Size down or close unrelated positions.
Release moment: monitor only. No trading in the first 60 seconds. Read all components of the release before judging hawkish or dovish.
Post-release (30 minutes after): assess the directional bias from the 30-minute candle close. Plan the reaction trade.
Reaction trade (1-4 hours after release): execute on a retest with structure-based stops.
End of week: review which events landed, which surprised, and how the cumulative picture has shifted.
How to Use Multiple Timeframes Around News Events
Most traders look at the same timeframe before an economic calendar release. That is a mistake.
Before a major event, I look at the daily chart to understand the trend. Am I buying dips or selling rallies? The daily chart tells me the bias.
Then I look at the 4-hour chart to identify key support and resistance levels. Where is the market likely to react?
Then I look at the 1-hour chart to time my entry. I wait for the release. I watch the spike. I wait for a retest of a key level on the 1-hour chart.
After the release, I switch to the 15-minute chart for execution. The 15-minute chart shows me the retest. It shows me the false breaks.
Using multiple timeframes around economic calendar events has improved my timing significantly.
Three Scenarios for Every Major Release
Before every major economic calendar release, I run three scenarios.
Scenario 1: Hot print (above consensus). If inflation is hot or jobs are strong, the dollar rallies, gold sells off, and the Fed stays hawkish. My plan: long dollar, short gold.
Scenario 2: Cold print (below consensus). If inflation cools or jobs miss, the dollar sells off, gold rallies, and rate cut bets return. My plan: short dollar, long gold.
Scenario 3: Inline print. If the print hits consensus, the initial reaction is often muted. I wait for the next catalyst or trade the technical levels.
I write these scenarios down before the release. I do not decide in the moment. The economic calendar tells me when the event is. I decide what I will do before it happens.
For a deeper look at gold trading strategies , this guide covers how CPI affects gold.
Real Examples: NFP, CPI, and FOMC in Action
Let me give you real examples from my trading.
NFP Example (May 2025): The consensus was 85K. The print came in at 172K. More than double. The dollar ripped from 98.50 to 100.00. I waited 30 minutes, watched the dollar hold above 99.50, and entered long. That trade made 150 pips.
CPI Example (April 2025): The consensus was for inflation to cool to 3.3%. It printed at 3.8%. Gold sold off from $4,700 to $4,500. I waited for the first spike to settle, then shorted gold on a retest of $4,600. That trade made $1,000 per contract.
FOMC Example (June 2025): Warsh’s first meeting as Chair. The dot plot shifted hawkish. The dollar ripped. I did not trade the same day. I waited until Thursday, entered on a pullback, and rode the trend for the rest of the week.
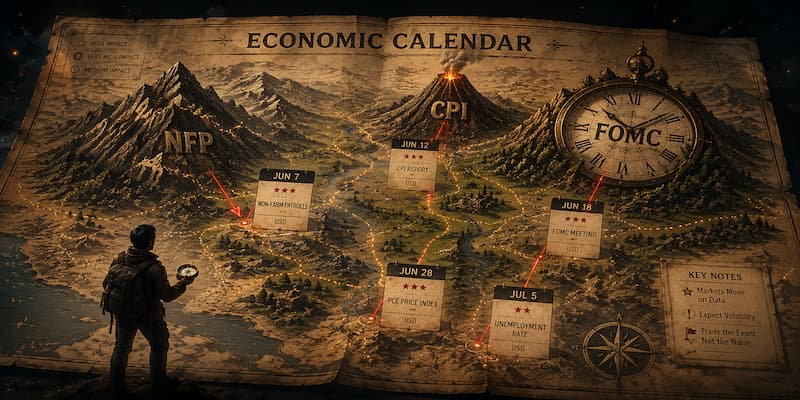
These are not theoretical examples. This is how I actually trade the economic calendar.
The Psychological Trap of Trading News
Trading economic calendar events is as much about psychology as it is about data.
The trap is this. You see a big spike. You feel the fear of missing out. You want to jump in. Your heart rate increases. Your palms sweat. You enter a trade without a plan.
I have been there. I have done it. I have lost money doing it.
The cure is preparation. Write down your scenarios before the release. Write down your entry levels. Write down your stop loss. Write down your take profit.
When the release happens, you are not deciding. You are executing. The economic calendar told you when the event would happen. You already decided what you would do.
If you have not written down your plan before the release, do not trade it. Sit on your hands. Watch. Learn. There will be another economic calendar event next week.
Common Mistakes Traders Make with the Economic Calendar
I have made every mistake on this list. Learn from mine.
Mistake 1: Trading the first spike. The worst execution window of the day. Spreads widen. Slippage is real. Wait 2-3 minutes.
Mistake 2: Ignoring the consensus. The actual number means nothing without the consensus. A beat on a weak consensus is different from a beat on a strong consensus.
Mistake 3: Pre-positioning on every event. You are gambling on a 50-50 outcome. The risk-reward is not in your favour.
Mistake 4: Trading every three-star event. Not every three-star event deserves your capital. Focus on the ones that move your markets.
Mistake 5: Forgetting the revision. The prior month’s number gets revised. A strong current print with a big downward revision is less bullish than it looks.
Mistake 6: Trading without a plan. If you have not written down your scenarios before the release, you are guessing. Guessing loses money.
Avoid these mistakes, and you will already be ahead of most traders.
Turning Volatility into Opportunity
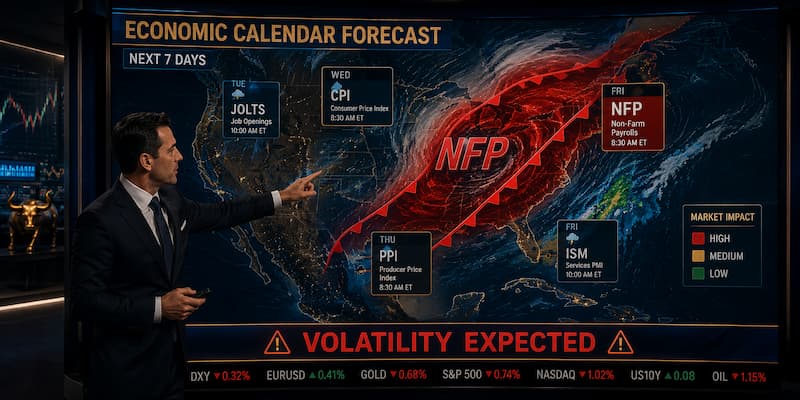
Trading forex can sometimes feel like trying to predict the weather. One moment, the market is calm, moving in a predictable trend. Then out of nowhere, a storm hits. Prices spike. Spreads widen. Traders scramble.
If you have ever been caught off guard by a sudden market move, an economic calendar event was behind it.
But what if you could see the storm coming? What if you knew exactly when these major market-moving events were scheduled and could plan your trades around them? That is what an economic calendar does.
An economic calendar is not just a tool. It is a roadmap to market movements. When you know when and why the market will move, you can plan and trade with confidence instead of reacting emotionally.
The best way to start? Use a reliable economic calendar. Filter to your traded currencies. Focus on three-star events. Pre-set scenarios. Trade the follow-through. And when the big moves happen, you will be ready.
Disclaimer
This article is for educational and informational purposes only. It does not constitute financial advice, trading recommendations, or an offer to buy or sell any asset. Trading forex, commodities, indices, cryptocurrencies, and futures carries significant risk and may not be suitable for all investors. You can lose more than your initial deposit. Past performance does not guarantee future results. Always read full terms, contract specifications, and risk disclosures before trading. Do your own research. Consult a licensed financial advisor if you need professional investment advice.