


This weekly wrap covers everything you need to know from the week of August 17–21, 2026. This was a week where the dollar’s own government did more damage to it than any single data release. A weak 20-year Treasury auction pushed the 30-year yield to its highest level since 2007, US federal debt crossed $40 trillion for the first time, and Treasury Secretary Scott Bessent responded Wednesday by doubling the size of the department’s long-bond buyback operations.
Yields dropped, the dollar fell to a three-month low, and gold had its best week since the spring. Layer on top of that a Strait of Hormuz ceasefire that formally lapsed mid-week with no replacement deal, and a Reserve Bank of Australia still talking about hikes while the Fed can’t agree with itself, and this was a five-day stretch with a lot more going on than the calendar suggested. The dollar index (DXY) closed the week near 98.8, off close to 1% and sitting just above Thursday’s three-month low around 98.50. This weekly wrap breaks down all the key moves.
The dollar was on the back foot from the opening bell Monday, extending a slide that started with Friday’s surprise 0.6% drop in July retail sales — a headline miss that undid the prior month’s 0.2% gain and reinforced the idea that the American consumer is finally feeling the burn of a year of elevated rates and a shaky labor market. That followed the July jobs report earlier in the month, which showed the economy shedding 23,000 positions against expectations for a solid gain, pushing unemployment to 4.1%.
The market’s read was straightforward: growth is slowing, and slowing growth plus cooling inflation (July CPI at 3.4% headline, core at 2.5%) is not a combination that supports a rate hike. This weekly wrap tracks the data cascade that reshaped the rate outlook.
For more on how the dollar moves gold, see our guide on how the dollar moves gold.
Weekly Wrap: The Dollar’s Decline
That backdrop had already pulled the implied odds of a September hike down to around 31–35% by midweek, from over 55% the week before. Then Wednesday’s FOMC minutes landed, and rather than settle the debate they extended it. The July meeting produced a 9-3 vote to hold the funds rate at 3.50–3.75%, with three regional presidents dissenting in favor of a hike — the first time since September 2016 that three policymakers have broken ranks in the same hawkish direction this early in a chair’s tenure.
New Fed Chair Kevin Warsh, who has deliberately stripped back forward guidance since taking over in May, gave markets little additional color, and Thursday brought a fresh log on the fire when President Trump directed criticism at Fed Governor Lisa Cook, adding a political layer to an already unsettled policy picture. This weekly wrap considers the Fed’s internal split a key risk.
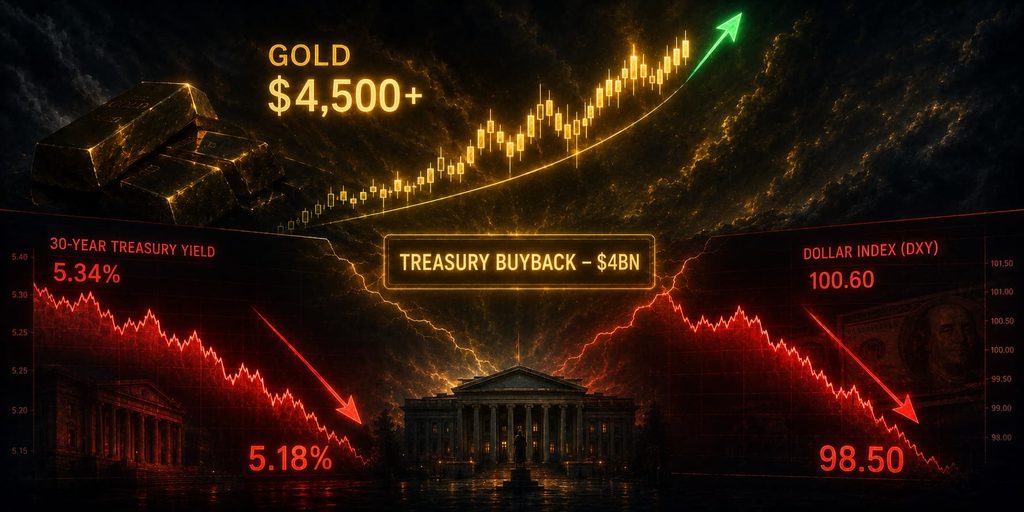
The dominant story, though, wasn’t the Fed at all — it was the Treasury. A $16 billion 20-year bond auction on Tuesday drew what traders called a “buyers’ strike,” sending the 30-year yield to 5.34%, its highest since 2007. Bessent answered Wednesday morning by announcing the Treasury would at least double the size of its liquidity-support buybacks for 10- to 30-year debt, from a $2 billion to a $4 billion maximum per operation, effective September 9. Long yields dropped as much as 10 basis points on the news (30-year: 5.26% to 5.18%; 10-year: 4.68% to 4.63%), equities firmed, and the dollar took another leg lower.
Yields partially retraced by Friday as the market questioned whether a buyback program can really offset a debt load approaching $40 trillion, but the dollar never fully recovered the ground it lost. By Friday, the DXY was hovering just above its three-month low, with the currency having fallen against nearly every G10 peer this week — its weakest showing was against the Swiss franc. This weekly wrap highlights the Treasury buyback as the week’s defining event.
This weekly wrap notes that the debt crossing $40 trillion is a psychological milestone. While the buyback program is designed to cap long-end yields, the underlying fiscal trajectory remains unchanged. Markets are increasingly questioning the sustainability of US fiscal policy, and the dollar’s decline this week reflects that unease.
Weekly Wrap: EUR/USD
The euro was a straightforward beneficiary of dollar weakness rather than a story in its own right this week. EUR/USD opened near 1.1537, tested the 1.1580–1.1600 resistance zone Friday, and closed in the mid-1.1500s to upper-1.1500s, its best levels since mid-June. There’s no major ECB catalyst this week — the central bank held its deposit rate at 2.25% in July and isn’t due to meet again until September — so the pair has essentially been trading as the inverse of the dollar story: soft US data in, euro strength out. This weekly wrap tracks the euro’s passive strength.
Eurozone flash PMIs and consumer confidence data released Friday were in line and didn’t materially move the pair. The 1.1600 level remains the line in the sand technically; a clean break opens the way toward 1.1660–1.1700, while rejection there keeps the pair anchored in its recent 1.1480–1.1600 range. With the ECB on the sidelines, EUR/USD is likely to keep taking its cues from US data and Fed positioning into next week’s Jackson Hole symposium. This weekly wrap considers 1.1600 the key level to watch.
Weekly Wrap: GBP/USD
Sterling had one of its stronger weeks of the summer, trading to three-month highs above 1.3550 as the “sell America” theme — a rotation away from dollar assets and into currencies backed by economies seen as having tighter fiscal discipline — took hold. Cable reclaimed the 1.3400 and 1.3500 levels that had capped it for most of July, with the early-May high near 1.3658 now the next technical marker, and the January high at 1.3870 the long-range target if the move extends. This weekly wrap tracks sterling’s breakout.
That said, the rally wasn’t a straight line: GBP/USD softened into Thursday, falling for three straight sessions to test 1.3450 as investors weighed mixed UK data against the broader dollar story, before recovering some ground on Friday’s PMI releases. UK CPI and preliminary PMI data both came in during the week without derailing the broader bullish structure. The bigger medium-term question for sterling is less about this week’s data and more about whether the Bank of England has to reverse course — its own projections point to inflation reaccelerating toward 3%+ by year-end on energy pass-through, which could complicate the currently dovish-leaning market narrative once that shows up in the data. This weekly wrap considers key level to watch.
Weekly Wrap: USD/JPY
The yen remains the most structurally interesting story in G10 right now, even though it was relatively quiet this particular week. USD/JPY has been trading in the high-140s to low-150s, a dramatic comedown from the 160+ levels seen in July, after coordinated intervention by Japan’s Ministry of Finance and the Federal Reserve temporarily strengthened the yen by roughly 5%. This weekly wrap considers the yen the most interesting G10 story.
This week’s price action tested whether that move can hold on fundamentals alone: Japan’s preliminary Q2 GDP came in at 1.1% annualized, below the 1.9% forecast and a step down from Q1’s 1.8%, while industrial production for June actually surprised sharply to the upside at 4.9% year-over-year versus 4.2% expected. Japanese trade balance data Thursday and inflation figures Friday closed out the week’s test of the intervention’s staying power.
Markets are currently pricing roughly a 76% probability of a BoJ hike at the September meeting, and the pair spent the week drifting toward three-day troughs near 147.00 as that hike pricing, combined with the broader dollar sell-off, kept pressure on USD/JPY from both directions. This is the one G10 pair where a genuine policy divergence — a hiking BoJ against a Fed that can’t decide whether it’s done — is doing real, sustained work on the exchange rate rather than just short-term positioning.
Weekly Wrap: USD/CHF
The franc was the standout performer against the dollar this week, and it wasn’t close — Switzerland’s currency was the strongest of the majors against a broadly weak greenback. USD/CHF slid to a two-month low near 0.795 in the wake of Wednesday’s Treasury buyback announcement, as the classic safe-haven bid (Hormuz tensions, US fiscal jitters) combined with the general dollar unwind to push the pair toward its lowest levels in two months. This weekly wrap highlights the franc’s safe-haven strength.
The SNB remains at a 0% policy rate with no signal of imminent change, so this move is almost entirely a dollar and risk-sentiment story rather than anything domestic. With the franc this firm, it’s worth watching as the likely first port of call if Hormuz headlines turn more acute over the weekend or into next week’s sanctions announcement.
Weekly Wrap: USD/CAD
The loonie had a genuinely constructive week on its own merits, not just as a dollar-weakness beneficiary. USD/CAD slid from the high-1.38s toward the high-1.37s, helped by a run of strong Canadian data: July employment rose by 75,000, pulling the unemployment rate down to a two-year low of 6.4%, while Canadian CPI eased to 2.8% in June from 3.2% in May — comfortably back inside the Bank of Canada’s target range. This weekly wrap tracks the loonie’s constructive week.
Firm oil prices, with Brent pushing back above $90 on the Hormuz standoff, added a second tailwind, since Canada’s currency tends to track crude fairly closely. Five-bank consensus forecasts still see USD/CAD grinding lower through year-end — from around 1.40 in Q3 to roughly 1.38 by Q4 — and this week’s price action was broadly consistent with that path, though a stalled US-Canada trade situation and the ongoing tariff overhang remain the main sources of two-way risk for the pair.
Weekly Wrap: AUD/USD
The Australian dollar quietly had one of its best runs of the year, closing Friday near 0.7167 — its highest level since June 3 and on track for an eighth consecutive weekly gain, outperforming every other major currency on the day. The RBA held its cash rate at 4.35% again this month and Deputy Governor Andrew Hauser was anything but dovish in his commentary, warning the central bank would need to hike again if upside inflation risks materialize — he specifically named the Middle East conflict, the AI investment boom, and weak productivity as his top concerns. This weekly wrap considers the RBA’s hawkish stance a key support for AUD.
That hawkish RBA stance, combined with the broadly weak US dollar and a rising gold price (which lifts sentiment toward commodity-linked currencies generally), gave AUD/USD enough support to grind through resistance most of the week. It’s worth flagging the tension underneath this rally, though: Australia’s own labor market has been softening at the same time .
July employment fell by 15,800, reversing June’s strong gain, and unemployment ticked up to 4.5%, a three-month high — so the RBA is now hiking rhetoric into a labor market that’s cooling, not tightening. That’s a setup worth watching for a sharper reversal if the data continues to soften even as the RBA talks tough.
Weekly Wrap: NZD/USD
The kiwi’s story this week is best understood as the mirror image of what’s happening in its economy: New Zealand’s Q2 CPI accelerated sharply to 4.1% year-over-year, up from 3.1% in Q1 and now well outside the RBNZ’s 1–3% target band, while the labor market has been softening at the same time — unemployment rose to 5.6% in Q2 from a revised 5.4% in Q1. The RBNZ hiked its Official Cash Rate to 2.50% in July, its first increase since 2023, and the market widely expects that tightening cycle to continue given the inflation overshoot. This weekly wrap tracks the kiwi’s stagflation-adjacent setup.
NZD/USD has broadly tracked the same dollar-weakness tailwind as its G10 commodity-currency peers this week, but the underlying setup here — a central bank forced to hike into a weakening jobs market to fight an inflation surprise — is the most stagflation-adjacent story on this board, alongside Australia’s, and is worth flagging for anyone running carry exposure in either currency: the yield support is real, but so is the growth risk underneath it.
Weekly Wrap: Oil Surges on Hormuz
Crude had a volatile, headline-driven week that ended firmly higher. Brent closed out the week trading above $91 and touched close to $94 intraday Friday, up roughly 5–6% on the week, while WTI settled in the mid-to-high $80s. The proximate cause was the formal expiration mid-week of the interim US-Iran ceasefire covering Strait of Hormuz shipping access, with negotiations to extend or replace it still deadlocked. Over the weekend before that, Israel struck targets in Lebanon, killing a senior Hezbollah commander, and by Tuesday the UAE had announced it was cutting financial ties with Iran in response to renewed missile attacks.
Iran, for its part, says the waterway will not reopen until the US lifts its naval blockade and unfreezes overseas Iranian funds — a condition Washington has shown no sign of accepting. This weekly wrap considers oil the most volatile asset of the week.
Adding to the pressure: the Treasury announced Monday that a new round of sweeping economic sanctions against Iran, which Treasury Secretary Bessent has been calling an “economic D-Day,” would be detailed the following Monday (August 24), aimed at cutting Tehran off from international banking, shipping registries and cash-transfer networks — a package that could also touch countries still trading with Iran, notably China. The IEA has separately warned this is shaping up to be the widest global oil supply deficit in five years given the persistent Hormuz disruption.
Money managers have reportedly trimmed bullish positioning on both benchmarks over the past couple of weeks even as spot prices climbed, a sign of genuine uncertainty about which way this resolves. Goldman Sachs’s base case remains that Brent moderates back toward $80 if Hormuz fully reopens, but every failed negotiation round this year has produced a fresh $5–10 spike, and the March peak above $114 is a reminder of how quickly this can move if the situation deteriorates rather than stabilizes.
According to the IEA’s latest Oil Market Report , global observed stocks fell 69 million barrels in July, and the agency now sees the widest supply deficit in five years for 2026.
For more on how geopolitical risk moves oil, see our guide on how geopolitical risk moves oil.
Weekly Wrap: Gold Rips on Treasury Buybacks
Gold’s week was defined by one event: Wednesday’s Treasury buyback announcement. Bullion had entered the week near $4,350, roughly two months off its highs after a bout of profit-taking, with soft US inflation data already doing some of the work of reducing rate-hike odds and supporting the metal. Then Wednesday’s news hit — the 30-year yield falling on the surprise buyback, the dollar dropping in sympathy — and gold spiked as much as 3.5–4% intraday, breaking back above its 100-day moving average near $4,387 for the first time in over two months and trading as high as $4,500.
It held the bulk of that gain through Thursday and Friday, settling the week around $4,520–4,550, roughly 5% higher on the week and its highest levels since late May, marking a third consecutive weekly gain. Silver rode the same wave, breaking back above $65 and touching levels near $66 intraday. This weekly wrap considers gold the standout performer of the week.
The structural backdrop remains supportive on multiple fronts beyond this week’s catalyst: central banks bought 288.9 tonnes of gold in Q2 2026 alone, up 62% year-over-year and the strongest second quarter on record per the World Gold Council, buying straight through a quarter when prices were actually falling — a sign this is reserve diversification, not momentum-chasing. UBS reiterated a 12-month target of $5,400 an ounce this week, citing rising global debt levels and sustained dollar weakness as the key drivers, while JPMorgan’s house view remains $6,000 by year-end.
The other side of the ledger is real and shouldn’t be waved away: US gold ETFs saw roughly $5.3 billion in redemptions last month as higher-for-longer repricing took hold, and three FOMC members explicitly wanted to hike in July, not cut — if that camp gains the upper hand into September, rising real yields would be a genuine headwind. Gold is currently sitting almost exactly on its 200-day moving average with the 50-day up near $4,730 as the next resistance test; how it behaves in that zone over the next couple of weeks will say a lot about which narrative wins out.
Weekly Wrap: Week Ahead – Jackson Hole and Iran Sanctions
Next week is unusually loaded, and the calendar’s headline event — Jackson Hole — lands right in the middle of an already tense macro backdrop. This weekly wrap prepares you for the week ahead.
Monday, August 24: The Treasury’s detailed Iran sanctions package (“economic D-Day”) is due to be unveiled, with markets watching for scope — particularly whether it touches countries still buying Iranian crude, which would have direct implications for oil supply and, by extension, every currency in this wrap with commodity exposure.
Tuesday–Wednesday: Expect continued digestion of the Treasury buyback’s implications for the long end of the curve, plus any follow-through Hormuz headlines given the sanctions rollout.
Wednesday, August 26: US Q2 GDP second estimate (8:30am ET) — the first real growth data point since last month’s weak jobs and retail sales prints, and a genuine swing factor for how the market prices the September Fed meeting. Nvidia reports earnings after the close the same evening, and July PCE — the Fed’s preferred inflation gauge — lands that same morning, making this the single most information-dense day of the week for both rates and equities.
Thursday–Saturday, August 27–29: The Jackson Hole Economic Policy Symposium, hosted by the Kansas City Fed in Wyoming. This year’s official theme is “Financial Innovation: Implications for Payments and Policy,” but as always, the real market event is the Fed chair’s keynote — and this is Kevin Warsh’s first Jackson Hole address since taking over as Chair in May, scheduled for Friday morning, August 28. Roughly half the FOMC penciled in 2026 hikes at Warsh’s very first meeting as chair in June, and three regional presidents dissented in favor of a hike at his second meeting in July — an unusually open internal split this early in a new chair’s tenure.
Warsh has told reporters he intends to keep the speech focused on long-run structural questions rather than near-term guidance, and has been deliberately curtailing forward guidance generally since taking office, so there’s a real chance the speech under-delivers on the near-term signal markets are hoping for. A Bank of America survey this month found 69% of fund managers expect a neutral, non-committal tone. That said, Jackson Hole keynotes have a long history of outgrowing their printed agenda — Bernanke used the 2010 edition to signal QE2, Powell’s 2022 speech delivered the famous warning about the “pain” of taming inflation.

The stakes are real: this lands just 19 days before the September 16 FOMC decision, and with hike-versus-hold odds for that meeting sitting close to even, Warsh’s tone (or lack of one) is likely to be the dominant driver of dollar, gold, and rate-sensitive currency direction for the last week of August. Combined with an unresolved Iran sanctions rollout and a Hormuz standoff still without a resolution, next week has the ingredients for the highest-volatility stretch of the month across FX, oil, and gold alike.
According to the CME FedWatch (https://www.cmegroup.com/markets/interest-rates/cme-fedwatch-tool.html) tool, the probability of a September hike has fallen from 67% on 31 July to roughly 33% after this week’s data.
Weekly Wrap: Deep Dive – The Treasury Buyback Program and Its Market Implications
This weekly wrap has already covered the Treasury’s surprise buyback announcement, but the implications deserve a deeper examination. The decision to double the size of liquidity-support buybacks for 10- to 30-year debt from $2 billion to $4 billion per operation is not just a technical adjustment—it is a signal about the Treasury’s perception of market fragility. This weekly wrap considers the buyback program a pivotal moment for bond markets.
The mechanics are straightforward: by buying back long-dated debt, the Treasury is effectively reducing the supply of long-term bonds in the market, which pushes prices up and yields down. This is the opposite of what the Treasury normally does, which is to issue new debt and increase supply. The fact that the Treasury felt compelled to intervene in this way suggests that the market for long-dated US debt is not functioning as smoothly as policymakers would like. This weekly wrap highlights the intervention as a sign of underlying stress.
The $16 billion 20-year bond auction on Tuesday was the trigger. The auction drew what traders called a “buyers’ strike,” with demand falling well short of supply. This sent the 30-year yield to 5.34%, its highest since 2007, and forced the Treasury to act. The buyback announcement on Wednesday was a direct response to that failed auction. This weekly wrap tracks the chain of events from auction failure to policy response.
The market’s initial reaction was positive—yields dropped, equities firmed, and the dollar weakened. But the longer-term implications are more complex. By intervening in the market, the Treasury is effectively acknowledging that it cannot rely on organic demand for its debt. This raises questions about the sustainability of US fiscal policy, particularly with the debt load now exceeding $40 trillion. This weekly wrap considers this the most important question for bond markets going forward.
JPMorgan strategists have warned that markets may view the Treasury’s surprise effort to curb long-term borrowing costs as lacking credibility, potentially pushing up the term premium and yields over time. This is the risk that markets are not pricing: that the buyback program is a short-term fix for a long-term problem. If markets lose confidence in the Treasury’s ability to manage the debt, the dollar could come under further pressure, and gold could continue to rally. This weekly wrap flags this as a key risk to watch.
Weekly Wrap: Key Levels Summary
| Instrument | Support | Resistance | Current |
|---|---|---|---|
| DXY | 98.50, 98.00 | 100.00, 100.50 | 98.80 |
| EUR/USD | 1.1480, 1.1400 | 1.1600, 1.1660 | 1.1550 |
| GBP/USD | 1.3450, 1.3350 | 1.3658, 1.3700 | 1.3550 |
| USD/JPY | 147.00, 145.00 | 150.00, 152.00 | 148.50 |
| USD/CHF | 0.7900, 0.7800 | 0.8050, 0.8100 | 0.7950 |
| USD/CAD | 1.3700, 1.3600 | 1.3850, 1.3900 | 1.3750 |
| AUD/USD | 0.7050, 0.6950 | 0.7200, 0.7250 | 0.7167 |
| NZD/USD | 0.6200, 0.6100 | 0.6350, 0.6400 | 0.6280 |
| Gold | $4,400, $4,350 | $4,550, $4,600 | $4,520 |
| Brent | $88.00, $85.00 | $94.00, $96.00 | $91.00 |
Weekly Wrap: The Bottom Line
The macro picture is increasingly clear. The dollar is breaking lower, gold is ripping higher, and oil is surging on unresolved Hormuz tensions. The Treasury’s buyback program has capped long-end yields, but the underlying fiscal trajectory remains unchanged. The Fed is divided, and Jackson Hole will set the tone for the remainder of Q3. This weekly wrap has tracked all of these moves.
Three things to watch next week:
- Warsh’s tone at Jackson Hole. If he leans hawkish, the dollar could recover. If he acknowledges the softening data, the dollar could break lower.
- Iran sanctions rollout on Monday. “Economic D-Day” could have significant implications for oil supply and commodity currencies.
- PCE data on Wednesday. The Fed’s preferred inflation gauge. A soft print reinforces the disinflation narrative. A hot print reopens the hike debate.
This weekly wrap has prepared you for all three scenarios. Now it’s up to you to execute.
Disclaimer
This article is for educational and informational purposes only. It does not constitute financial advice, trading recommendations, or an offer to buy or sell any asset. Trading forex, commodities, indices, cryptocurrencies, and futures carries significant risk and may not be suitable for all investors. You can lose more than your initial deposit. Past performance does not guarantee future results. Always read full terms, contract specifications, and risk disclosures before trading. Do your own research. Consult a licensed financial advisor if you need professional investment advice.