


Candlestick patterns are one of the oldest and most popular tools for conducting technical analysis in the financial markets. They have been around for a long time. They originated in 18th-century Japan, where rice traders needed a reliable way to visualize daily price movements and the mood of the markets. These traders developed a system to capture the open, high, low, and close prices of rice contracts over a given period, clearly showing how the market moves up and down.
As the name hints at, candlestick patterns have stood the test of time. The type of analysis is commonly thought to have been developed by a rice trader named Homma who was from the small town of Sakata in Japan. Pre-dating the western bar chart by a century, Homma created what were to become modern candlestick patterns because he realized that rather than supply and demand, it was trader emotion that was the biggest variable driving the price swings in rice.
Candlesticks display all the market information you need such as the open, close, high, and low. However, they also show the level of emotional volatility within that trading period. These emotional swings in traders can be shown through patterns that are essential for any trader to understand. Candlestick patterns allow you to determine a trend reversal at an early stage or the entry point into a trade. Understanding candlestick patterns is fundamental to successful trading.
For more on the mental discipline required in trading, see our guide on trading psychology and discipline.
Anatomy of a Candlestick
Each candlestick represents the trading activity for whatever period of chart you are looking at. If it’s an hourly chart, each candle represents one hour of trading, a 5-minute chart means each candle is 5 minutes and so on. Regardless of time period, each candle is made up of two components and can be used in exactly the same way to conduct the analysis. Understanding the anatomy of candlestick patterns is the first step to mastery.
The Candle Body
The main body of the candle shows us the opening price and closing price for the period, as well as the direction of the market for that specific time. When the closing price is higher than the opening price, the market is considered bullish and the main part of the candle is typically a lighter color. If the closing price falls below the opening price, the market is considered bearish and the body is usually shown in darker tones.
Candles can be drawn in any colors you choose using modern trading software. However, the most common are green bodies for a rising price and red for a falling price. If the main body is green, this indicates the price is trading higher than the previous close. By contrast, a red candle body indicates the price is trading below the previous close. The higher the growing candle, the more buyers there are in the market, the stronger the demand. This indicates market growth. The lower the falling candle, the more sellers there are. This indicates a decline in the market.
The Candle Wick/Shadow
The wicks, also known as shadows, extend from the body to highlight the extremes of the trading session. The upper wick represents the highest price reached during the session, while the lower wick shows the lowest price. The length of the wick is a signal of how extreme the price movements were during the session.
Shadow is the maximum and minimum price for a given period. More often than not, the longer the shadow, the stronger the market sentiment. In some situations, a shadow can signal a change in trend. For example, if a candle was growing strongly, but began to fall towards the close and developed a large upper shadow and a narrow body, then, most likely, buying dominated during trading, and by the end of the session investors changed their point of view.
Together, the body and wicks give investors a lot of visual information about price action and market sentiment. The precise details of the open, close, high, and low values combine to form recognizable candlestick patterns, and this visual representation helps investors quickly understand how the market is moving.
Candle Color
Trading platforms usually offer two color pairs – green and red or white and black. There is no difference between these pairs; both pairs show either a rise in price or a fall. A red and black candlestick indicate a fall in price, and a green or white candlestick indicates an increase. A red candle indicates that the price has dropped for the selected timeframe unit. A green candle indicates the price has risen. Candlestick patterns are color-coded for quick visual assessment.
Bullish Candlestick Patterns
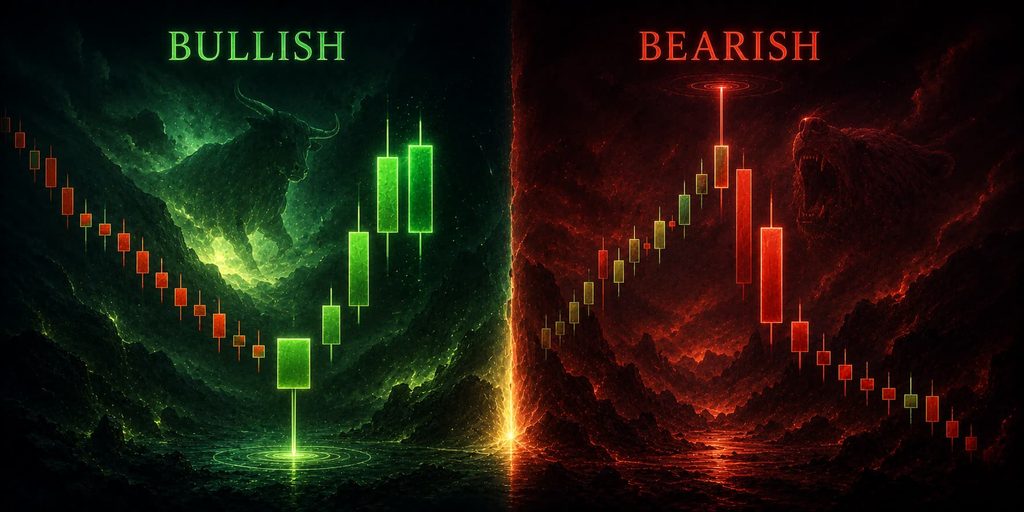
Bullish candlestick patterns signal that the market may be reversing from a downtrend to an uptrend. These formations indicate that buyers are gaining control. Understanding these candlestick patterns is essential for identifying potential buying opportunities.
1. Hammer
The hammer pattern describes a candle that has a long wick underneath (the shadow) and a small body at the top that is at most half the length of the shadow. While the name is all about the resemblance to a hammer, to understand the psychological aspects of this, we need to explore this in more detail.
The shadow is formed when the stock or other security trades much lower than its opening price, but then rallies and closes near or above the open price, creating that small body at the top. On a downtrend, it can signify areas in which demand has returned after an overreaction occurred and smart money came in to buy the value. On an uptrend, it may mean an overreaction occurred and smart money came in to sell the inefficiency that was created from a euphoric move.
For trading, what this means is a potential trend reversal in either direction. The longer the shadow, the more likely the reversal, and if the close is higher than the open, then it is an even clearer signal that the trend is turning. Out of all candlestick patterns, this setup is likely the most popular that is used by traders. The color of the candle body does not matter for this candlestick pattern.
2. Inverse Hammer
An inverted hammer is where the body appears at the bottom of the candle, with a long wick above it. That is caused by the price rising significantly above the open price, and then retreating again to close near or below the open price. This candlestick pattern is similar to the hammer but inverted.
Again, this can appear at the bottom of a downtrend, but what is behind the price moves that cause it. What the inverted hammer shows is that buyers moved the price up significantly but met resistance and the candle ultimately closed roughly where it started. That shows that buyers were starting to lead the direction, and it is another good indicator of a change in direction. This candlestick pattern suggests that buyers will soon have control of the market.
3. Bullish Engulfing
A bullish engulfing candlestick pattern usually occurs at the bottom of a downtrend, and it consists of two candles. The first, smaller candle reflects the current trend, so a body signifying a lower close than open on a downward trend. The second candle has a body showing the opposite, so a higher close than open, with that second candle body completely overlapping, or engulfing, the body of the previous candle.
While this can be a good sign of a reversal, turning a downtrend to an upwards one, confirming that change is important. For effective trading strategies using engulfing patterns, this means looking at the preceding and following candles to see where the market is going. A reversal should become clear quite quickly. This candlestick pattern indicates that buyers have overwhelmed sellers.
4. Morning Star
The morning star is a three-candle formation that marks the reversal of a downward trend. This pattern is considered bullish, meaning that the market is moving away from selling pressure toward buying interest. The middle candle will have a closing price below of the first candle on the bullish morning star pattern, showing a turn towards an uptrend after bottoming out. This candlestick pattern is one of the most reliable reversal signals.
Two candles stand side by side: the first is falling, the second is a doji (the candle opened and closed at the same price), and its opening price is lower than the closing price of the first candle. Then follows the third, growing candle. The color of the doji does not matter. After such a combination is formed, you can expect the price to move upward. This candlestick pattern is highly regarded by traders.
5. Piercing Line
The piercing line is a two-stick candlestick pattern, made up of a long red candle, followed by a long green candle. There is usually a significant gap down between the first candlestick’s closing price, and the green candlestick’s opening. It indicates a strong buying pressure, as the price is pushed up to or above the mid-price of the previous day. This candlestick pattern signals a strong reversal.
This candlestick pattern is a great depiction of buyers and sellers struggling to find direction within a specific time period. As with all candle setups, this time frame can be applied anywhere from the 1-minute candle to the 1-week candle. This candlestick pattern is seen as a signal for a short-term reversal.
6. Three White Soldiers
The three white soldiers pattern occurs over three days. It consists of consecutive long green (or white) candles with small wicks, which open and close progressively higher than the previous day. It is a very strong bullish signal that occurs after a downtrend, and shows a steady advance of buying pressure. This candlestick pattern is one of the strongest bullish signals.
This formation means that there’s sustained buying pressure and a strong upward trend. The absence of wicks shows that sellers did not have enough strength to even slightly temporarily raise the price up. This candlestick pattern indicates that bulls are firmly in control.
Bearish Candlestick Patterns
Bearish candlestick patterns signal that the market may be reversing from an uptrend to a downtrend. These formations indicate that sellers are gaining control. Recognizing these candlestick patterns is crucial for identifying potential selling opportunities.
1. Shooting Star
A shooting star is a variation of the hammer that forms at the top of the trend. This is essentially an upside down hammer that shows heavy intraday buying pushing price to new highs but then heavy selling adding supply to the market causing the price to move back down near the open. Price then continues to drop over the next few time periods. This candlestick pattern is a reliable bearish reversal signal.
This candle is an inverted hanging man, the candle wick is on top, the body is still several times smaller than the wick. Buyers pulled the price up, but at some point the forces of sellers began to dominate and pushed the price down and a wick was formed. This candle can also be found at the beginning of a bearish trend. This candlestick pattern indicates that sellers are gaining control.
2. Hanging Man
A hanging man candle formation is a variation of the hammer except that it shows up at the top of the trend. The hanging man essentially is showing that enough supply was loaded onto the market to drive the price down intra-day but demand was still strong enough to absorb this short term. However, notice how price starts to trend downwards over the next 15 or so time periods. This candlestick pattern warns of a potential reversal.
This candle appears at the end of a bullish trend. The candle is red, the body is several times smaller than the wick, the wick is directed downwards. Such candle means that buyers did not have enough strength to pull the candle up (so that it turned green), sellers (short sellers) began to dominate. This candlestick pattern signals that the trend may be ending.
3. Bearish Engulfing
A bearish engulfing pattern appears at the top of an upward trend to signify the possible change of direction short term. Here, the smaller first candle will have a body with a higher close than open. The second, larger candle, features a gap up from the previous close followed by lower close than the previous open, entirely engulfing the previous candle. Volume preceding this setup will generally be the confirmation traders are looking for. This candlestick pattern is a strong bearish signal.
The first candle is green, the second is red. The red candle is larger than the green one (both below and above); it seems to cover the green candle. It also speaks about the prevailing forces of sellers. This candlestick pattern indicates that sellers have overwhelmed buyers.
4. Evening Star
The evening star is a three-candle formation showing that upward momentum is fading. The opposite of the morning star, this pattern is considered bearish and means that the market might be headed into a downturn. The evening star doji has the same setup as the morning star doji except for the placement on the chart which is at the top of a trend instead of the bottom. This candlestick pattern is a reliable bearish reversal signal.
This pattern consists of three candles, the first is green, the second is short green (possibly with wicks), and the third is red. The second candle reflects the struggle for dominance between buyers and sellers, and the third red candle indicates the victory of sellers. This candlestick pattern signals that a downturn is likely.
5. Dark Cloud Cover
A potential indication the end of an uptrend and the beginning of a reversal is coming, Dark Cloud Cover is a two-candle formation that begins with a candle that follows the overall trend. The second candle is the opposite direction, with an open price well above the closing price of the first candle, creating a significant gap in price to the upside. The second candle must close below the midpoint of the first candle. This candlestick pattern is a reliable bearish signal.
This pattern shows the buyers under pressure and the sellers overcoming them at the top of a trend, and it is a reliable mark towards a short-term downturn at a minimum. This candlestick pattern indicates that sellers are taking control.
6. Three Black Crows
The pattern consists of three red candles without wicks. They show the beginning of a confident downward movement, and the absence of wicks shows that buyers did not have enough strength to even slightly temporarily raise the price up. This candlestick pattern reflects persistent selling pressure and might mean that a downtrend will continue.
Three consecutive bearish candlesticks with small or no wicks represent a strong bearish signal. This candlestick pattern indicates that sellers are firmly in control with no buying pressure.
Continuation Candlestick Patterns
Candles that do not reflect the dominance of buyers or sellers are called continuation patterns. These can help traders to identify a period of rest in the market, when there is market indecision or neutral price movement. Understanding these candlestick patterns helps traders know when the market is pausing.
1. Doji
The Doji pattern appears when the opening and closing prices coincide. Such a candle will reflect the struggle between buyers and sellers, which ultimately does not lead to profit for either party. Although the Doji candle itself does not reflect the superiority of either side, it can often be found in other patterns, such as the bullish morning star and the bearish evening star. This candlestick pattern indicates indecision.
A candle with a very small body shows that the opening and closing prices were almost the same, and it’s usually a sign of indecision. A doji is a signal that the market is undecided about direction.
2. Spinning Top
The spinning top pattern is somewhat similar to a Doji, the candle has shadows at the top and bottom and a small body. Typically this pattern indicates a battle between a bullish and bearish trend, and the candle after the spinning top can set the trend. If there is a green candle, then the trend is bullish, if it is red, then the trend is bearish. This will show which side won after fighting each other. This candlestick pattern signals a pause before the next move.
This pattern shows a battle between buyers and sellers with neither side winning decisively. The next candle often determines the direction.
3. Rising Three Methods
The rising three methods pattern is bullish, between two long green candles there are three red ones, without going beyond the boundaries of the green ones. This pattern reflects a short-term dominance of the bears, but the bulls soon take control of the market again. This candlestick pattern indicates that the uptrend will continue.
4. Falling Three Methods
The falling three methods pattern signals a continuation of the current bearish trend. The model consists of a long red candle, three small green ones, and the model also closes with a long red candle. Green candles are within the red candles. This suggests that the bulls at some point wanted to reverse the market, but their strength was not enough and the bears again seized control. This candlestick pattern indicates that the downtrend will continue.
How to Use Candlestick Patterns Effectively
This is just the beginning when it comes to identifying candlestick patterns. They can help investors spot investing opportunities, but they’re also heavily used in trading to help traders choose their entry and exit points. Trading candle patterns can be useful ways to make sense of a dynamic, hectic trading environment. Here are some steps that traders might take to leverage trading candle patterns:
Review the Candle Chart
Analyze the chart to observe the overall market trend and identify key price levels. Pay attention to each candlestick’s shape, size, and position to get a sense of the market’s current sentiment. Understanding candlestick patterns in the context of the broader trend is essential.
Identify Key Candlestick Formations
Look for recognizable patterns, such as the hammer, doji, or engulfing formations. Recognizing these candlestick patterns quickly is a skill that develops with practice.
Interpret Market Sentiment
Look at the body and wicks of each candlestick to see what the balance is between buying and selling pressure. This can help traders anticipate when trends are more likely to continue or move in reverse. Candlestick patterns provide insight into market psychology.
Decide on Entry and Exit Points
Once they identify a significant pattern, traders use it to pinpoint the optimal moments for entering or exiting a trade. This can help to limit investment risks. Candlestick patterns help traders find high-probability entry and exit points.
Cross-Reference with Other Indicators
To confirm the candlestick signals, traders also check other technical indicators, like moving averages, relative strength index (RSI), or volume analysis. This also helps reduce the risk of false signals. Candlestick patterns should not be used in isolation.
Wait for Confirmation
As with all candlestick trading strategies, confirming the signal is the first step of the trade. That means waiting for the next candle to close. Candlestick pattern trading is all about patience and observing the market. If the next candle has a higher low (for bullish patterns), that means that the support has held and the buyers are now outpacing sellers in the market. Confirmation is key when trading candlestick patterns.
For more on risk management and position sizing, see our guide on risk management strategies.
Common Mistakes to Avoid When Trading Candlestick Patterns
Using Candlestick Patterns in Isolation
You cannot enter into a trade based only on candlestick patterns; candlestick patterns are an addition to a trading strategy. They should be used in conjunction with other technical and fundamental analyses to make informed trading decisions. Candlestick patterns are tools, not complete strategies.
Ignoring the Broader Trend
Candlestick patterns are more reliable when they align with the broader trend. A bullish pattern in a downtrend may be a reversal signal, but it needs confirmation. A bullish pattern in an uptrend may simply be a continuation signal. Always consider the context of candlestick patterns.
Confusing Patterns in Volatile Markets
In volatile or sideways markets, candlestick patterns can sometimes be misleading. The sensitivity to time frames means that the accuracy of candlestick patterns can change depending on the chart’s time scale. Be cautious when trading candlestick patterns in choppy conditions.
Overlooking the Need for Confirmation
Candlestick patterns can be misinterpreted, so it’s important to check other technical indicators as well. The next candle provides crucial confirmation. Never enter a trade based on a single candlestick pattern without confirmation. Confirmation is essential when trading candlestick patterns.
Trading Without a Stop Loss
Always use a stop loss when trading candlestick patterns. A common area to place it is just below the low point of the reversal signal, or the high point for a move downwards. However, sometimes it is important to add a little extra cushion in case HFT (high-frequency trading) machines are looking for a group of stop losses to take out. This is crucial for protecting capital when trading candlestick patterns.
Combining Candlestick Patterns with Price Action
Candlestick patterns are most effective when combined with other forms of price action analysis. Support and resistance levels, trendlines, and chart patterns can all confirm signals from candlestick patterns. For example, a hammer forming at a major support level is a stronger signal than a hammer forming in the middle of a range. Understanding candlestick patterns in the context of price action is essential.
For more on price action trading, see our guide on price action trading.
Benefits and Limitations of Candlestick Patterns
Benefits of Candlestick Analysis
Clear visual representation: Candlestick patterns give investors a simple, visual, and streamlined way to assess the market.
Easy to identify trends: Familiar formations like the hammer or doji make it easy to know when there are potential reversals or continuations, so traders can react quickly.
Simplicity: The straightforward design of candlestick charts makes them accessible, even to investors who are new to technical analysis.
More insights: Combining the open, high, low, and close prices in one visual helps investors understand the balance between buying and selling pressure in trading.
Limitations of Candlestick Analysis
Potential for false signals: In volatile or sideways markets, candlestick patterns can sometimes be misleading.
Historical data: These patterns reflect past price movements and may not reliably predict market behavior in the future.
Sensitivity to time frames: Depending on the chart’s time scale, the accuracy of candlestick patterns can change.
Need for confirmation: Candlestick patterns can be misinterpreted, so it’s important to check other technical indicators as well.
candlestick patterns help investors figure out what’s going on in the market. These patterns can suggest when the trend might change, and traders can improve their strategies by looking at different candlestick formations. Still, it’s important to use other tools to manage the risks of investing and make smarter trades. For a comprehensive overview of candlestick analysis, visit Investopedia – Candlestick Patterns
Conclusion: Mastery Comes from Practice
Candlestick patterns are one of the oldest and most popular tools for conducting technical analysis in the financial markets. Candlestick patterns are not an end-all-be-all to being successful in trading but they are a resource that can be helpful when looking for high-probability trades when coupled with other forms of analysis.
The key to candlestick pattern trading is recognizing the patterns on your chart. It is very easy to look at old charts and pick out the patterns, but somewhat more of a challenge to do it in real-time on a live chart. Once a pattern is identified, it is vital to confirm a change of direction before entering a trade, as with all trading, nothing is 100% accurate and sometimes the market throws a curveball and does something unexpected.
As trading becomes more automated and programmed, it will be interesting to see if these patterns continue to become more and more self-fulfilling as more eyes become latched on the same targets. However, the emotional swings in traders that candlestick patterns reveal will likely always be present. Understanding candlestick patterns helps you read the market’s emotional state.
Whether you approach candlestick patterns manually or use automated tools, they provide exceptional insight into market behavior and the psychology of traders. Once you learn to recognize them quickly, creating a trading strategy that fits with your own personality and trading style will lead you to success.
Mastering candlestick patterns takes time and practice. Start with the basic formations, practice identifying them on historical charts, and gradually incorporate them into your trading strategy. With consistent practice, candlestick patterns will become an invaluable part of your trading toolkit.
Disclaimer
This article is for educational and informational purposes only. It does not constitute financial advice, trading recommendations, or an offer to buy or sell any asset. Trading forex, commodities, indices, cryptocurrencies, and futures carries significant risk and may not be suitable for all investors. You can lose more than your initial deposit. Past performance does not guarantee future results. Always read full terms, contract specifications, and risk disclosures before trading. Do your own research. Consult a licensed financial advisor if you need professional investment advice.