


Introduction: The backtesting That Lied to You
You’ve spent weeks developing a trading strategy. The backtesting results look incredible – a Sharpe ratio above 2.0, consistent profits month after month, and an equity curve that climbs steadily upward. You’re ready to deploy real money.
Stop right there.
Your backtesting lied to you. Not because you’re dishonest, but because backtesting is fundamentally dangerous. Even a flawless backtest is probably wrong .
The harsh reality is that many strategies producing impressive backtesting metrics fail catastrophically in live trading. A Vontobel Asset Management study demonstrated this dramatically: with just five imaginary stocks, a Sharpe ratio could be catapulted from 0.1 to 10.6 simply by shifting timestamps, ignoring delisted stocks, fine-tuning parameters, and restricting the backtesting window .
The problem might not be your strategy at all. The real culprit? Your data and your approach to backtesting.
This article explains why backtesting results are misleading, what the “reality delta” is, and how to fix it before you risk real capital.
Backtesting is the process of taking your trading strategy and applying it to historical market data to see how it would have performed. According to Investopedia – Backtesting , it’s one of the most important steps in strategy validation.
What is Backtesting and Why Does It Matter?
Backtesting is the process of taking your trading strategy and applying it to historical market data to see how it would have performed in previous markets.
In other words, you’re asking:
“If I had traded this strategy over the past few months, years, or even decades… what would my results look like?”
Why Backtesting Matters
The number one reason most traders fail is that they jump into the market with a strategy they haven’t tested. When things go wrong, they have no idea if the problem is the system or their execution.
But if you’ve conducted proper backtesting, you know what kind of performance to expect. You know the drawdown is temporary, not a sign that your system is broken. You know the average win, the average loss, and how many losers in a row are normal.
This is what builds confidence.
Confidence that your strategy works, not because someone said so, but because you’ve seen the raw data with your own eyes.
And that confidence? It’s what helps you keep executing even when things get uncomfortable:
- When you’re in a drawdown
- When the setup hasn’t shown up in weeks
- When your friend is bragging about some “new indicator” and you’re tempted to switch gears
For a complete walkthrough on how to backtest properly, check out our [Guide to Backtesting and Optimizing Forex Trading Strategies].
Manual vs Automated Backtesting
Now that you know what backtesting is, you need to know that there are two main ways to do it:
Manual Backtesting
This is where you scroll through charts one candle at a time, apply your rules, and track the results manually. It takes time, but that is actually great for learning. Through this process, you’ll develop pattern recognition, get a feel for price movement, and understand how your system behaves across different market conditions.
Automated Backtesting
This is where you program your rules into a platform like TradingView, Amibroker, or Python and run it across years of data in seconds. Its benefit is that it is super fast and very efficient, but the catch is that it only really works if your system is rule-based and clearly defined. There is no room for “I’ll use my discretion” here.
Each method has its place. Manual backtesting helps you internalize the strategy. Automated backtesting helps you stress-test it at a massive scale.
The Downside of Backtesting
It’s Not Real Trading
This is a big one. There’s no emotion in backtesting. No fear, no FOMO, no pressure from real money. You might think you’d execute the trade cleanly… but live trading is a different story. Backtesting shows if the system has an edge, but not whether you can trade it.
It Ignores Slippage, Spread, and Broker Quirks
Historical price charts don’t include real-world trading costs. That perfect entry you got at the candle close in your backtesting? In reality, you might’ve been filled late… or not at all. These small differences add up, especially on lower timeframes.
Manual Backtesting Can Be Subjective
If your rules aren’t clear, you might bend them in the moment to justify an entry or exit that “feels right.” That introduces bias, and your results may not reflect how you’d actually trade live. Be as honest as you can – the only person you’re cheating if you bend the rules is yourself.
What is Forward Testing?
Forward testing is the process of testing your trading strategy in real time, one trade at a time, using either a demo account or very small live position sizes. It’s also known as paper trading, and it’s the natural next step after backtesting.
Think of it like this: you’ve done the homework, you know the strategy makes sense on historical data. Now the question becomes:
“Can I actually trade this strategy in real market conditions, without making mistakes?”
That’s what forward testing helps you answer.
Instead of fast-tracking through hundreds of trades in a day, forward testing forces you to slow down and trade one setup at a time, just like you would with real money.
And that’s where a lot of hidden issues start to show up.
Why Forward Testing Matters
Here’s the truth most traders don’t want to hear:
You can have the best backtested system in the world… but if you can’t execute it live, it’s worthless.
Forward testing puts your strategy under real-world pressure:
- Live price movement
- Real-time decision-making
- Waiting, hesitation, fear, second-guessing
- Market conditions that don’t play out as cleanly as they did in the past
It shows you how your system performs when you’re in charge, not scrolling through the past with perfect hindsight.
The Key Benefit: Real Experience, Without Real Damage
Most traders skip this phase. They either over-trade on demo with no plan, or they go live too early without testing anything, and end up sabotaging themselves before they’ve built the habits to succeed.
But when you forward test properly, with structure, tracking, and discipline, you begin to create a bridge between theory and real-world trading.
You don’t need to prove your system works anymore; that’s what the backtesting was for. Now you’re proving that you can trade it, under pressure, in real time, with all the noise and hesitation that comes with it.
The Downside of Forward Testing
It’s Slow
Probably the biggest reason people skip forward testing… there’s no fast-forward button. You have to wait for each trade to form, trigger, and play out. Building a meaningful sample size might take weeks or even months, and that can test your patience.
You’re Working with Small Data
Because you’re taking one trade at a time, your early results might feel random. You might hit three winners in a row and feel overconfident, or take three losses and feel like the system doesn’t work. But it’s just noise in the larger picture. You need to give it enough time to reflect the edge you found in your backtesting.
You Might Lose Discipline Without Structure
A lot of traders “demo trade” without a clear plan. They try different setups, change rules on the fly, and don’t track their results, so they never learn anything because the data is now corrupt. If you’re not forward testing with structure, it becomes random clicking, not a learning process.
Backtesting vs Forward Testing: Key Differences
By now, you’ve probably noticed that backtesting and forward testing serve two different purposes.
| Aspect | Backtesting | Forward Testing |
|---|---|---|
| Purpose | Tests if the system has an edge | Tests if you can trade the system |
| Speed | Fast (hours to days) | Slow (weeks to months) |
| Data | Historical | Live real-time |
| Emotion | None | Real pressure |
| Costs | Often ignored | Realistic |
| Focus | Strategy logic | Execution discipline |
Backtesting tells you if the system has an edge. It’s fast, data-driven, and helps you build confidence in the logic behind your system.
Forward testing tells you if you can trade the system. It reveals execution mistakes, emotional challenges, and real-world issues.
Think of it as one tests the strategy. The other tests the trader.
If you want long-term consistency, you need both.
The Reality Delta: Why Strategies Degrade Live
Even well-built trading strategies degrade 10 to 20% when moving from backtesting to live. You already know this number exists. You’ve seen it in passing, heard it mentioned in trading communities, maybe even read about it in some backtesting guide.
But here’s what nobody really explains: that 10–20% isn’t random. It’s not luck and it’s certainly not a sign your strategy is broken.
It’s predictable – and if you understand where it comes from, you can actually account for it before you risk real capital.
The gap has a name: the reality delta.
Every strategy lives in two worlds:
- The backtest world – a controlled environment where conditions are theoretically perfect
- The live market – where nothing about those perfect conditions actually exists
The difference isn’t subtle – it’s structural.
In a backtest, fills happen at whatever price you programmed them to happen at. In live trading, fills happen at the price someone else is willing to give you, which is often worse, and sometimes dramatically worse.
In a backtest, there’s no order queue, no latency, no spread that widens exactly when you need it to tighten. In live trading, all of these exist simultaneously.
However, the most important difference is psychological.
A 10-trade losing streak in a backtest is a statistic you observe on a chart. A 10-trade losing streak in a live account is ten decisions made in the presence of real stress, real money moving in the wrong direction, real doubt about whether you made a mistake.
Your body doesn’t differentiate between financial loss and physical threat – the stress response is identical. That changes everything about how you execute the next trade.
This is why the 10–20% rule exists and why understanding each component of it is the difference between a strategy that survives the transition and one that collapses within weeks.
Before you start, learn how to set up your historical data correctly in [The Essential Guide to Backtesting on Historical Data].
The Cost Problem in Backtesting
Pull up any strategy backtest. Look at the average winning trade. Let’s say it’s $30.
Now ask: how much of that $30 actually ends up in your account?
For most traders, the honest answer is a lot less. The backtesting will never tell you this unless you deliberately force it to.
Here’s what a realistic cost structure looks like:
- Commission costs – Realistic for your broker
- Spread costs – Modeled (not assumed at mid-price)
- Slippage – Included during volatile periods
- Round-trip costs – Subtracted from average winner
The slippage line is where most backtesting completely disconnects from reality.
During normal market hours, slippage is minor, maybe a tick or two. However, during news events, earnings releases, or liquidity gaps, slippage can swing the profitability of an entire trade. A backtest that doesn’t model this, or models it as a flat figure, makes it look dramatically better than the actual live strategy during the exact moments that matter most.

This is the first reality check: subtract realistic round-trip costs from your average winning trade. If the math breaks down after that subtraction, you don’t have an edge.
The Overfitting Trap
You’ve probably seen it. A strategy with an 80%+ win rate, smooth equity curve, drawdowns that look trivial. Everything inside you says: this is too perfect.
You’re right. It probably is.
Overfitting happens when a strategy’s rules get tightened, adjusted, or cherry-picked until they fit the historical data extremely well. The problem is they’re fitting to noise, not to actual market patterns.
This works beautifully in a backtest because the backtesting only knows about the past. But the moment the strategy encounters new market data (which is literally every trade once you go live), it breaks.
Here’s how to spot overfitting in backtesting:
- Higher win rates than realistic (real strategies are usually 45–65%)
- Equity curves that almost never dip (unrealistic)
- Performance that completely falls apart on new data
- Rules that need constant tweaking to work
The guard against overfitting is simple: Lock your rules completely and don’t touch them afterwards. Then test those locked rules on a period of data you never looked at during development.
If the strategy collapses, it was fit to the past. If it holds reasonably well, you might actually have something.
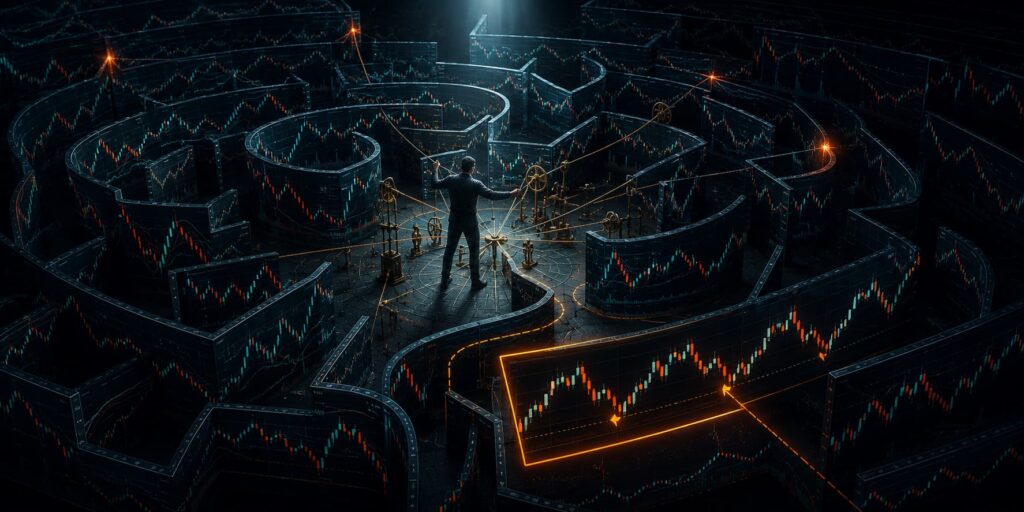
Market Regime Risk
A strategy backtested from 2020–2022 lived through one of the most unusual volatility regimes in recent history. A strategy backtested from 2016–2018 lived through a relatively benign, low-volatility trending environment.
Both backtests are “successful.” Both are also potentially misleading.
Every strategy has a preferred market condition:
- Trend-following systems – Print money in strong directional markets, bleed out in choppy ranges
- Mean-reversion systems – Thrive in stable ranges, get obliterated in momentum rallies
The backtesting will look great or terrible depending almost entirely on which regime dominated your test period. And you have zero control over which regime shows up when you go live.
This means your backtesting answered one question: “Did this strategy work during this specific market regime?”
It never answered: “Will this strategy work during every regime I’ll face live?”
The fix is simple: Test your strategy across three deliberately different market periods:
- A trending period
- A ranging period
- A high-volatility spike period
Run your locked rules through each one separately. A strategy that holds up reasonably across all three has a much more credible foundation than one that only survived one regime.
The Psychology Gap
Here’s what every trader discovers eventually: executing rules in a backtest and executing rules under real stress are two completely different activities.
In a backtest, you follow the rules. They’re applied mechanically. A losing trade is a line on a chart. A drawdown is a number you review later.
In a live account with real capital, your body responds and the decision-making gets worse. That discipline you had when reviewing charts vanishes the moment price moves against you.
What happens next is predictable:
- You move your stop loss (“just this once”)
- You size down after losses and size up after wins (revenge sizing)
- You skip valid signals because they feel risky
- You hold winners longer than your rules allow (hoping)
None of this is conscious weakness. It’s a physiological response to conditions the backtesting never created.
This is where the 10–20% degradation really comes from. Not from costs alone, but from the gap between mechanical rule-following and rule-following under stress.
Research on trading psychology shows that traders who experienced pressure during practice (not just reviewing charts, but actively making decisions as prices moved) performed significantly better in live trading than those who only reviewed static charts.
The Transition Plan: From Backtest to Live
Most traders jump from backtesting to live in one leap.
Backtest looks good → confidence builds → allocate capital.
What’s missing is the stage in between, and that missing stage is where most strategies die.
The sequence that actually works:
1. Validate with out-of-sample data (locked rules)
Test your strategy on data it never saw during development. If it holds up, move to step 2. If it collapses, you were overfitting. Go back and rebuild.
2. Walk-forward test
Re-test your strategy across rolling time windows, not just one static period. This mimics how conditions actually shift over time in live trading.
3. Replay-based practice
Practice your execution on real historical market conditions using a replay tool. Actively make entry and exit decisions as candles form. Journal your rule adherence separately from your P&L.
4. Monte Carlo simulation
Shuffle the order of your historical trades 1,000+ times. This shows you the realistic distribution of possible drawdowns, not just the maximum drawdown your backtesting happened to see.
5. Small live size (30–50 trades, fully journaled)
Go live at a size small enough that losses don’t hurt your judgment. Log every trade. Compare this live data to your backtesting expectations.
6. Scale only when live matches backtest (within reasonable range)
After 30–50 trades, you have real data. If live P&L is within 10–15% of backtesting expectations and rule adherence is strong, the transition is working. Scale gradually from there.
Conclusion: Trade with Confidence, Not Hope
The gap between backtesting and live trading is not a failure of backtesting. It is a feature that shows backtesting is a filter, not a guarantee.
A good backtest tells you the strategy could work. It does not tell you the strategy will work in live conditions.
If you understand each component of the gap – costs, overfitting, regime risk, and psychology – and validate each one before going live, you eliminate most of the uncertainty. The 10–20% degradation is no longer random. It becomes predictable, manageable, and something you have already accounted for.
The traders who make the transition successfully are not the ones with perfect backtests. They are the ones who did the validation work and understood exactly what their backtesting was telling them.
Remember: Most traders skip steps. They either rush into live trading with no data… or they obsess over backtests and never learn to execute.
But if you want to trade with real confidence, not guesswork, you need both:
- Backtesting – Shows whether your system has an edge
- Forward testing – Proves you can execute that system in real time
It’s not about finding the “perfect” strategy. It’s about building conviction, building discipline, and building trust – in both your system and yourself.
Take the time to backtest properly. Forward test with structure. And when you’re ready, scale up with clarity, not emotion.
Because that’s how real traders are built. Not overnight. But one trade at a time.
Disclaimer
This article is for educational and informational purposes only. It does not constitute financial advice, trading recommendations, or an offer to buy or sell any asset. Trading forex, commodities, indices, cryptocurrencies, and futures carries significant risk and may not be suitable for all investors. You can lose more than your initial deposit. Past performance does not guarantee future results. Always read full terms, contract specifications, and risk disclosures before trading. Do your own research. Consult a licensed financial advisor if you need professional investment advice.