


How does inflation affect asset prices? This is the question every trader, investor, and policymaker is asking right now. Inflation expectations are the invisible anchor that determines whether inflation becomes a temporary shock or a persistent regime.
Inflation is affecting the prices we pay for food and fuel. It is also likely to reduce the prices of financial assets, at least until the extent of central bank interest rate rises becomes clear to investors. The levels of inflation expectations we are seeing today are not normal, and this will have knock-on effects on the prices of financial assets like shares and bonds.
Specifically, if this bout of inflation brings about the end of the low interest rates of the last 30 years and the ultra-low interest rates of the last decade, then asset prices will continue to fall. This article explains how inflation expectations drive bond yields, gold prices, the dollar, and equities. It also provides a framework for trading in the current regime.
For a deeper look at [how the Fed shapes the dollar], this guide covers the transmission from policy to FX.
What Are Inflation Expectations?
Inflation expectations are the rate at which people, businesses, and investors expect prices to rise in the future. They are not the same as current inflation. They are forward-looking. And they matter more than current inflation for asset prices.
Why do inflation expectations matter more than current inflation? Because asset prices are based on future cash flows. If investors expect higher inflation in the future, they will demand higher returns to compensate. That changes the discount rate. And that changes asset prices today.
Inflation expectations are measured in several ways. Each measure tells a slightly different story about what the market or the public believes.
Breakeven inflation rates are the gap between nominal bond yields and inflation-protected bond yields (TIPS in the US, linkers in the UK). If the nominal 10-year yield is 4.5% and the TIPS yield is 2%, the breakeven is 2.5%. That 2.5% is the market’s best guess at average inflation over the next ten years. This is the cleanest measure because it is based on real money, not surveys.
Survey-based measures ask households and businesses what they expect inflation to be. The University of Michigan survey and the New York Fed’s Survey of Consumer Expectations are the most widely followed. These measures are useful for understanding consumer behavior.
Market-based measures like inflation swaps and breakevens are preferred by traders because they reflect real money, not opinions. These are the most reliable measures for trading purposes.
For the official source, the Federal Reserve publishes data through the FRED database.
The Fed’s Credibility and the Anchoring Effect
Inflation expectations are anchored when they remain stable despite temporary shocks. The Fed’s credibility is the anchor. If the market believes the Fed will do whatever it takes to keep inflation near 2%, then a temporary energy shock does not change long-term expectations.
If that credibility erodes, the market starts to believe inflation will be persistently higher. That is when asset prices really move. The unanchoring of inflation expectations is the risk that every macro trader should be watching.
The current regime is testing that credibility. Inflation has been above 2% for years. The Fed held rates at 3.50 to 3.75 per cent in June, and the market is now pricing a 37.6% chance of a July hike. The question is whether the Fed can bring inflation expectations back to target without breaking the economy.
This is the key issue for asset prices. If inflation expectations remain anchored, the Fed can cut rates when growth slows. If they become unanchored, the Fed must keep rates high even if growth slows. That is the stagflation scenario.
For the official source, the Federal Reserve publishes the monetary policy framework that shapes the outlook.
How Inflation Expectations Drive Bond Yields
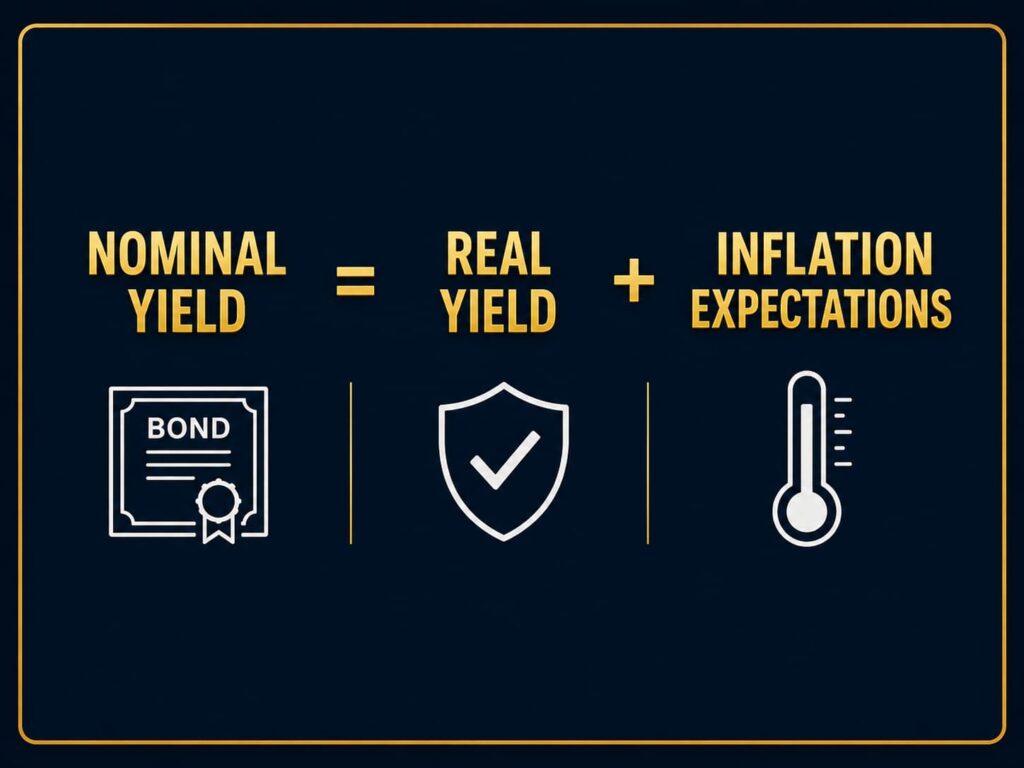
Bond yields are the most direct transmission channel for inflation expectations. The nominal yield on a government bond is the sum of the real yield and expected inflation. This is the Fisher equation, named after economist Irving Fisher. When expectations rise, nominal yields rise. When they fall, nominal yields fall.
Nominal yield = Real yield + Inflation expectations
Today, inflation expectations are elevated. The 10-year breakeven rate has been running near 2.5%, which is above the Fed’s 2% target. That is why the 10-year Treasury yield has been stuck near 4.5% despite a softening economic outlook.
If inflation expectations rise further, bond yields will rise. That will tighten financial conditions, pressure equities, and support the dollar. If they fall, bond yields will fall, easing financial conditions and pressuring the dollar. The direction of inflation expectations determines the direction of bond yields.
The bond market is the market that pronounces its predictions most loudly. Because bonds’ cash flows are stipulated at issuance, it is only their price on secondary markets that varies, thereby determining the return or yield. This allows us to infer what compensation the average buyer requires for holding debt. This compensation is driven by the inflation outlook.
For more on [interest rates and forex], this guide covers how yields drive the greenback.
Why Gold Moves with Inflation Expectations
Gold is often described as an inflation hedge. But the relationship is more nuanced. Gold is not a hedge against current inflation. It is a hedge against inflation expectations becoming unanchored. This is the key insight for gold traders.
When inflation expectations are anchored, gold struggles. When they become unanchored, gold rallies. This is why gold has been heavy near $4,000 despite elevated inflation. The market believes the Fed will eventually bring expectations back to target. Gold is waiting for a shift.
Gold has two main inputs: real yields and inflation expectations. When real yields rise, gold falls. When expectations rise faster than nominal yields, real yields fall and gold rallies. The key is the relationship between nominal yields and the inflation outlook.
If inflation expectations rise and nominal yields do not keep pace, real yields fall and gold rallies. This is the bullish scenario for gold. If nominal yields rise faster than expectations, real yields rise and gold falls. This is the bearish scenario.
The current environment is the latter. Nominal yields have been rising faster than inflation expectations, keeping gold under pressure. This is why gold is heavy near the $4,000 to $4,050 area. A shift in the outlook could change that.
The Dollar and Inflation Expectations
The dollar’s reaction to inflation expectations is more complex than gold. Higher expectations are not automatically bullish for the dollar. The dollar’s reaction depends on whether the Fed is perceived as credible. This is the key nuance for FX traders.
If the Fed is credible, higher inflation expectations lead to higher nominal yields. That attracts foreign capital and supports the dollar. This is the standard dollar-bull case.
If the Fed is not credible, higher inflation expectations lead to fears of currency debasement. Foreign investors demand a risk premium to hold dollars. The dollar weakens.
Right now, the Fed is perceived as credible. Warsh’s hawkish pivot has anchored inflation expectations enough to keep the dollar bid. The dollar index is near 101.5, and the trend is up.
But the risk is that inflation expectations become unanchored if the data turns. That would reverse the dollar’s structural bid. This is the scenario the desk is watching into the July jobs report and CPI. A shift in the outlook could flip the dollar’s direction.
Equities and Inflation Expectations
Equities are the most complex asset class when it comes to inflation expectations. The relationship is non-linear and depends on the level and persistence of inflation. Understanding this relationship is essential for equity traders.
Moderate inflation (2-3%) is generally positive for equities. It signals healthy demand and allows companies to raise prices. Expectations in this range are well anchored and do not disrupt equity valuations.
High inflation (4%+) is negative for equities. It forces the Fed to raise rates, which increases the discount rate and compresses valuations. Expectations in this range are dangerous for equity markets.
Deflation is also negative for equities. It signals a demand collapse and falling profits.
Today, we are in the high inflation regime. CPI has been running near 4.2%. Inflation expectations have been elevated. That is why equities have been volatile and narrow. The S&P 500 is near 7,136, supported by AI mega-caps while the rest of the market lags.
The key risk is that inflation expectations become unanchored. If the market believes inflation will be persistently above 4%, the Fed will have to hike aggressively. That would crush equity valuations. A shift in the outlook is the biggest risk for equities.
For more on [market structure and equities], this guide covers how the Fed’s policy path affects stock valuations.
The 2026 Regime: Sticky Inflation and Hawkish Fed
The current regime is defined by sticky inflation and a hawkish Fed. CPI is at 4.2%, the highest in over three years. Core PCE is at 3.3%. Inflation expectations have remained elevated throughout 2026. This is the backdrop for all asset prices.
The Fed under Warsh has pivoted hawkish. The dot plot shows a majority of members expecting no cuts in 2026. Some are even pricing a hike. This is the most hawkish Fed stance in years. The Fed is determined to anchor inflation expectations.
The market is pricing a 37.6% chance of a July hike. A month ago, that number was a rounding error. The direction of inflation expectations is clear: they are not falling fast enough. The market is adjusting to a higher inflation outlook.
This is the regime that defines asset prices. Bonds are under pressure. Gold is heavy. The dollar is bid. Equities are fragile. All of these are a function of the inflation outlook and the Fed’s response. A shift in inflation expectations would change everything.
Historical Context: The 1970s and Now
The 2020s may echo the 1970s. Inflation is being driven by factors that reduce economic capacity: pandemic-related supply constraints and soaring energy costs. The monetary policy context is different from the 1970s, with inflation being explicitly targeted by an operationally independent central bank.
Under inflation targeting, which started in 1992, the average bank rate has been 3.4%, compared with 5% for the 297 years that preceded it. Lowering interest rates has been the monetary policy response to economic and political uncertainty for a generation.
But central banks have a history of delivering either price stability or financial system stability. In the long run, they have not been effective at delivering both. As criticism mounts for not delivering on its inflation target, a period of rising interest rates closer to their historical average seems likely. This will lower asset valuations.
The 1970s experience shows that when inflation expectations become unanchored, it takes a severe recession to bring them back. This is the risk that the Fed is trying to avoid. Understanding the inflation outlook is the key to understanding this regime.
How to Trade Inflation Expectations
Trading inflation expectations is not about guessing the CPI print. It is about understanding the Fed’s reaction function. Here are three practical approaches.
1. Watch the breakevens. The 10-year breakeven is the cleanest measure. If it rises above 2.6%, expect a hawkish Fed response. If it falls below 2.2%, expect a dovish shift. This is the cleanest signal.
2. Trade the Fed’s credibility. The dollar and gold are a direct read on the inflation outlook. If the Fed is credible, the dollar stays bid and gold stays heavy. If credibility erodes, the dollar falls and gold rallies.
3. Position into data prints. CPI and PCE are the key catalysts. Position before the print, not after. Use the 15-minute rule to avoid the first spike. This is how professionals trade.
For more on [risk management during news events], this guide covers position sizing before high-impact releases.
Does Inflation Matter for Asset Prices?
Money is the oldest, most evolved and most important financial instrument. It is effectively a lubricant for trade – the oil between the cogs. It is involved in every trade in a transitory way. Markets need it as it dramatically increases the efficiency of trade.
Even before the introduction of cash, there are examples of societies using items such as salt, seashells or even cacao beans as ‘money’ in their trades. The diverse and eclectic history of money is important when considering today’s bout of inflation. It is just the oil in the machine – the form and denomination don’t matter.
This has long been recognised. Inflation expectations adjust and what you can buy with your returns from investing will be determined by the risk and patience associated with investing. But people are slow to adjust their expectations and assume that the present state of flux is abnormal.
Whether it be instantly or with a six-month or 20-year lead, how quickly investors adjust their inflation expectations will determine the impact of today’s inflation on asset prices over the coming months and years. Investors may be being optimistic in their valuation of assets today.
Inflation often shows up in financial headlines and investor conversations. If you are investing in the US stock market, you have probably noticed that inflation data may influence how markets move – sometimes in ways that are not immediately predictable. The reason is always the inflation outlook.
The Yield Curve and the Recession Signal
One of the most reliable indicators for inflation expectations and asset prices is the yield curve. When short-term yields are higher than long-term yields, the curve is inverted. Historically, an inverted yield curve has preceded every US recession since the 1970s.
Today, the 2-year Treasury yield is near 4.18% and the 10-year yield is near 4.34%. The curve is not deeply inverted, but it is flat. That tells you something important about inflation expectations. The market is pricing a Fed that will hold rates high in the near term but will eventually cut as growth slows.
If inflation expectations rise, the curve will steepen. That means the market expects higher inflation and higher long-term rates. That is bad for bonds and equities but can be supportive of gold.
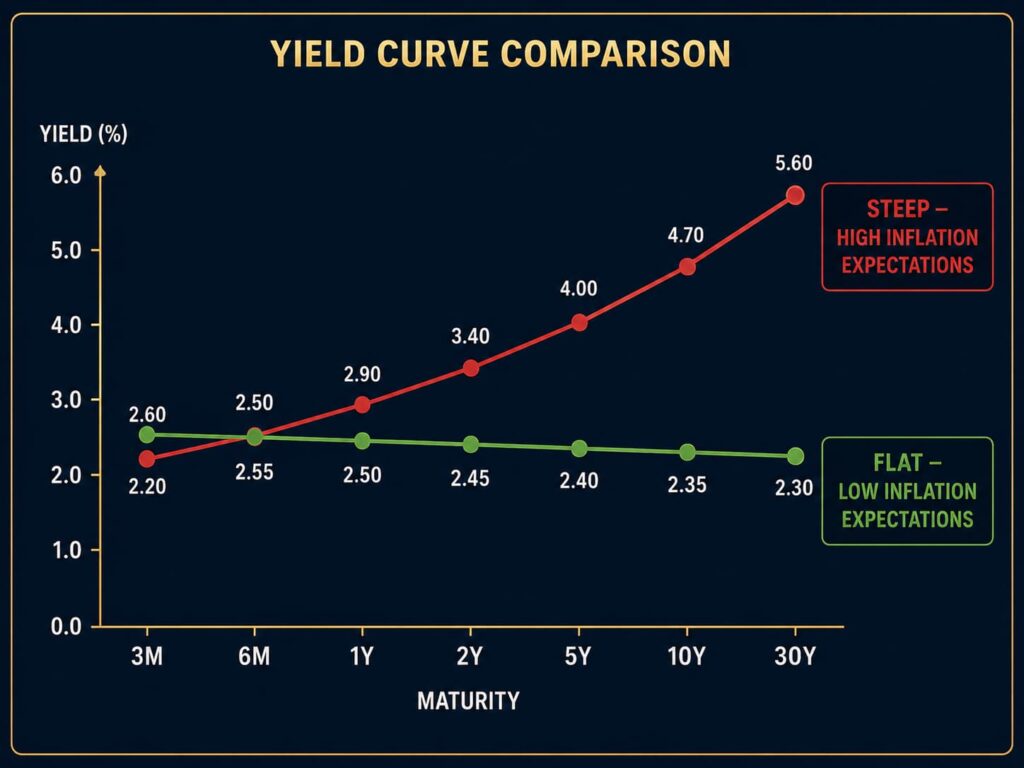
If inflation expectations fall, the curve will flatten further or invert. That means the market expects lower inflation and lower long-term rates. That is good for bonds and equities but can pressure the dollar.
Bottom Line
Inflation expectations are the anchor for asset prices. They determine bond yields, gold prices, the dollar, and equity valuations. Right now, they are elevated but anchored. The Fed’s credibility is intact, but it is being tested.
The key question for traders is whether inflation expectations become unanchored. If they do, asset prices will re-price dramatically. Bonds will fall further. Gold will rally. The dollar will weaken. Equities will struggle.
If they remain anchored, the Fed can cut rates when growth slows. That would support risk assets. The dollar would soften. Gold would rally modestly. Equities would find a floor. Anchored expectations are the bull case for risk assets.
The 2026 regime is defined by this tension. Watch the breakevens. Watch the Fed. And watch inflation expectations. They are the invisible anchor that determines everything else.
Disclaimer
This article is for educational and informational purposes only. It does not constitute financial advice, trading recommendations, or an offer to buy or sell any asset. Trading forex, commodities, indices, cryptocurrencies, and futures carries significant risk and may not be suitable for all investors. You can lose more than your initial deposit. Past performance does not guarantee future results. Always read full terms, contract specifications, and risk disclosures before trading. Do your own research. Consult a licensed financial advisor if you need professional investment advice.