


This market recap covers the week of May 25-29, 2026. The macro picture was dominated by one big tension: ceasefire hopes driving risk assets higher, while sticky inflation kept the Federal Reserve hawkish in the background.
Oil crashed 15% this month on reports of a 60-day ceasefire extension between the US and Iran. Gold tested critical $4,400 support. The dollar stayed bid near 99.13. And the S&P 500 hit fresh record highs above 7,500.
But here is the catch. The deal is drafted, but not signed. Trump has not approved it. Iran has not formally confirmed. This market recap breaks down what is real, what is still risk, and what to watch next week.
Every market recap should answer three questions: what moved, why it moved, and what comes next. That is what this market recap delivers. No fluff. No hype. Just the levels, the data, and the desk view. A good market recap does not predict. It prepares. This market recap is built for traders who need signal, not noise.
As we covered in [central bank policy and the dollar], the Fed’s reaction function remains the single most important variable for the dollar and gold.
The Big Picture: Stagflation Signal Flashes
The most important data point this week – and the one markets are still digesting – was the Q1 GDP revision and the April PCE print.
| Metric | Previous Estimate | Revised Actual | Signal |
|---|---|---|---|
| Q1 GDP Growth | 2.0% | 1.6% | Slowing economy |
| PCE Inflation (April) | — | 3.8% YoY | Highest since May 2023 |
| Core PCE | — | 3.3% YoY | Sticky inflation |
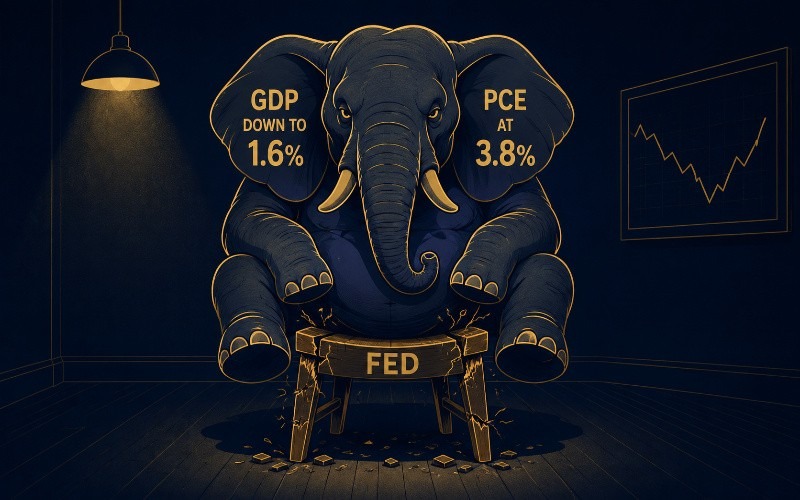
This is the stagflation signal. GDP revised down. Inflation at 3.8%. The worst of both worlds.
The Fed is trapped. Lower growth argues for rate cuts. Sticky inflation argues for hikes. This tension is why the dollar stayed supported this week and why gold struggled.
For a deeper look at [economic indicators explained for traders], our guide covers how to interpret GDP, PCE, and jobs data in real time.
US Dollar (DXY): Bullish But Trapped
The dollar is stuck in a range near 99.13, but the bias is toward a break higher. This market recap identifies two opposing forces.
The Bull Case for USD
| Factor | Details |
|---|---|
| Inflation is sticky | April PCE rose 3.8% YoY – largest since May 2023 |
| Yields are higher | 10-year Treasury near 4.46%, 2-year up roughly 70 basis points since the war started |
| Fed may need to hike | Markets now pricing about a 50% chance of a 2026 rate hike; cuts are off the table |
| US economy resilient | GDPNow tracking 3.8% Q2 growth; corporate profits remain strong |
“If oil prices stay high and the Fed signals it is tightening, you could see the dollar strengthen further.” – Thierry Wizman, Macquarie Group
The Cap on USD
| Factor | Details |
|---|---|
| Ceasefire hopes | US and Iran reportedly agreed to a 60-day ceasefire extension |
| Trump has not signed off | Deal not finalized; Vance says “uncertain” |
| Long-term bearish structural view | Deficits and valuations still weigh on the dollar medium-term |
Key quote from [UBS G10 FX Research]:
“The path of least resistance is toward a stronger dollar against low-yielding currencies like the yen and the euro.” – Shahab Jalinoos
The dollar won the week, but not decisively. The ceiling near 99.50 held. The floor near 98.30 held. Next week’s jobs report will likely decide the next move.
Oil (WTI): Crashing on Ceasefire Hopes
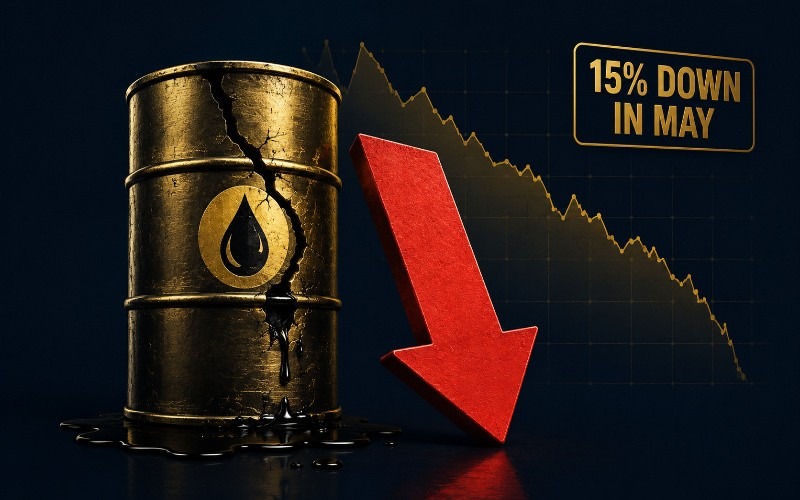
Oil is getting crushed. Third straight day of losses. Down roughly 15% this month.
Why Oil Is Falling
| Catalyst | Details |
|---|---|
| 60-day ceasefire extension reported | US and Iran tentatively agreed; Iran to clear mines within 30 days |
| Strait of Hormuz could reopen | Shipping through the critical chokepoint would resume |
| EIA inventory draw missed expectations | 3.3 million barrels versus 4.1 million expected – supply not as tight as feared |
The Caveats – Why Oil Could Bounce
| Risk Factor | Details |
|---|---|
| Trump has not approved | The president has not signed off on the deal |
| Nuclear program disagreement | Tehran’s nuclear ambitions remain unresolved |
| Oman threats | Trump threatened to “blow up” Oman for discussing Hormuz with Iran |
| Physical supply still disrupted | Even with a deal, normalization takes time |
“The optimism, however, remains capped amid US-Iran disagreements over Tehran’s nuclear program.” – FXStreet analysis
This market recap treats oil as the most binary trade right now. If the deal collapses, oil spikes back toward $100 fast. If the deal holds and the Strait reopens, oil could test lower levels.
Gold (XAU/USD): Safe Haven Appeal Is Breaking
Gold is testing critical support near $4,400. The traditional “buy gold when there is war” play is not working.
Why Gold Is Falling Despite Geopolitical Risk
| Factor | Impact on Gold |
|---|---|
| Higher yields | Real rates rising = higher opportunity cost for holding gold |
| Stronger dollar | Inverse correlation holding |
| Fed hike odds | Markets pricing rate hikes – bad for non-yielding assets |
| ETF inflows stalled | Retail demand has collapsed; March saw largest outflows since 2021 |
“Higher oil prices are fueling inflation fears, and that has pushed Treasury yields up and strengthened the U.S. dollar – a negative combination for gold.” – [FOREX.com analysis]
“This drift lower suggests that there is sustained pressure being built under the surface.” – Fawad Razaqzada,
What Could Save Gold
| Catalyst | Potential Impact |
|---|---|
| Strait of Hormuz resolution | Lower yields, weaker dollar – gold support |
| Central bank buying continues | 244 tonnes in Q1; expected 800 tonnes in 2026 |
| Recession fears materialize | Could force the Fed to pivot despite inflation |
For a deeper look at [gold market analysis], our guide covers the key levels and the relationship with real yields.
S&P 500: Record Highs But Risks Building
Stocks are at all-time highs, driven by AI enthusiasm and ceasefire optimism.
What Is Driving the Rally
| Factor | Details |
|---|---|
| AI trade remains strong | Semiconductors up roughly 80% since March low; Nvidia, Broadcom leading |
| Ceasefire optimism | 60-day extension report easing geopolitical fears |
| Earnings growth | S&P 500 Q1 earnings up about 27% year over year |
| Resilient economy | GDPNow tracking 3.8% Q2 growth |
The Risks Ahead
| Risk Factor | What to Watch |
|---|---|
| Next week’s Jobs Report (June 5) | Expected +96k jobs, unemployment 4.3%. Hot print = more Fed hike fears |
| Broadcom earnings (Wednesday) | Test of the AI trade |
| Rising yields | 10-year at 4.46% – if yields spike, stocks could correct |
| Overheating economy | “We are talking about a potentially overheating economy” – Edward Jones strategist |
“If you were to get a hot employment report alongside still-rising inflation numbers, I think it continues to change the outlook for Fed policy.” – Liz Ann Sonders, Schwab
What to Watch Next Week
Before looking ahead, let us pause on where this market recap stands. The dollar is stuck near 99.13. Oil has crashed 15% this month. Gold is testing $4,400. The S&P 500 is at record highs. That is the snapshot. The thread tying it all together is the Iran deal. If it signs, this market recap will look prescient. If it collapses, this market recap will need a rewrite. That is the binary risk. That is why this market recap treats headlines as signals, not conclusions.
| Day | Event | Why It Matters |
|---|---|---|
| Wednesday | Broadcom earnings | Test of the AI trade |
| Friday (June 5) | US Jobs Report | Hot print = Fed hike fears = dollar up, stocks down |
The jobs report is the main event. If it comes in hot, the dollar could break higher and gold could break lower. If it comes in soft, the dollar could give back gains and gold could bounce.
One Final Thought for the Weekend
This market recap ends with a reminder. Markets are pricing a best-case scenario: a ceasefire holds, oil stays down, inflation cools, and the Fed cuts rates. That is a lot of hope packed into one price. The risk is that reality does not cooperate. The deal is not signed. Inflation is still at 3.8%. The jobs report could surprise to the upside. Traders who assume the benign outcome is guaranteed are leaving themselves exposed. Hope is not a strategy. Respect the range. Watch the data. And do not chase a headline that has not been signed.
As this market recap has shown, the week was defined by one tension: ceasefire hopes versus sticky inflation. The dollar stayed bid. Oil crashed. Gold tested support. The S&P 500 ignored the risks and hit record highs. A thorough market recap does not just list what happened. It explains why. That is what this market recap has done. The next move depends on two things: the Iran deal and the jobs report. This market recap will be back next week to break it down again.
Bottom Line
The market is walking a tightrope between ceasefire optimism and sticky inflation reality. Oil is down 15% this month on deal hopes, but the deal is not signed. Gold is testing $4,400 support as real yields rise. The dollar is stuck in a range, waiting for the next catalyst.
Next week’s jobs report will likely decide the next move. Watch the number. Watch the Fed. And watch the Iran headlines. The binary outcome is still in play.
Have a great weekend.
Disclaimer: This article is for educational and informational purposes only. It does not constitute financial advice, trading recommendations, or an offer to buy or sell any asset. Trading forex, commodities, indices, cryptocurrencies, and futures carries significant risk and may not be suitable for all investors. You can lose more than your initial deposit. Past performance does not guarantee future results. Always read full terms, contract specifications, and risk disclosures before trading. Do your own research. Consult a licensed financial advisor if you need professional investment advice.